Mascil Project
Sports Physiology and Statistics
If I want to build up my heart, where should I start? Science scholars use statistics in a sports physiology setting during an insightful experiment. Groups measure resting and active heart rates and develop a scatter plot that shows the...
PHET
CME Plotting
Young scientists build on their previous knowledge and apply it to coronal mass ejections. By plotting the path of two different coronal mass ejections, they develop an understanding of why most don't collide with Earth.
Science Matters
Plot Study
Small groups investigate plots of land to discover how abiotic and biotic factors interact. After recording their findings, scholars share observations with peers and self-reflect on the learning process.
Curated OER
Mystery Liquids: Linear Function
High schoolers determine the linear equations of the density of water and oil by collecting data on the mass of various volumes of each liquid. They construct scatter plots from the data and use these to write the linear equations for...
Curated OER
Environmental Agents of Mathematics: Mathematics for Change
High schoolers analyze environmental science data using Math. They do research about renewable energy, gather data, create graphs and interpret their findings. Then the group presents their arguments persuasively using their findings to...
Beyond Benign
Water Bottle Unit
How much plastic do manufacturers use to create water bottles each year? The class explores the number of water bottles used throughout the years to determine how many consumers will use in the future. Class members compare different...
Las Cumbres Observatory
Plotting an Asteroid Light Curve
Data can tell us a lot about celestial objects that are just too far away to study otherwise. Learners examine data on the brightness of an asteroid to predict its rotation rate. Graphing the data reveals a periodic pattern that allows...
Las Cumbres Observatory
Plotting a Supernova Light curve
Supernovas burn for a short time but can give scientists extensive information about the universe. Learners analyze given data about the change in the light magnitude of a supernova. They look for patterns in the data and use them to...
PBS
Data Plots of Exoplanet Orbital Properties
Scientists discovered the first exoplanet in 1995 and by early 2018, they confirmed the existence of more than 3,700—that's a lot of data! As part of the PBS 9-12 Space series, scholars interpret data about exoplanets. They compare...
Curated OER
Plotting Earthquakes
Students explore earthquakes. Using the National Earthquake Information Center website, students plot daily earthquakes on a map. They observe the magnitude of each earthquake. Students identify the pattern of earthquake locations and...
Curated OER
Creating a Basal Area Measuring Tape
Students use formulas to design and create a table. In this calculations lesson students create basal measuring tapes that will be used to measure woodlot stocking levels.
Curated OER
Trail Impact Study
Students create maps through trails that keep the environment safe. in this trail plotting lesson, students mark off a trail to show hazards, erosion threshold, and slope. Students record information about their trail...
Curated OER
Corn-Crop is a Bin-Buster
Learners calculate percent change and create lists of data. They enter the corresponding bushels of corn measured in billions to their list and display, then convert the acres into scientific notation and use the value on the home screen...
Curated OER
Volcanoes: Sixth Grade Lesson Plans and Activities
Bring a set of pre-lab, lab, and post-lab lesson plans on volcanoes to your earth science unit. Sixth graders explore the three types of volcanoes found on Earth, plot the specific locations of these volcanoes on a map, and...
Teach Engineering
Density Column Lab - Part 2
Groups suspend objects within layers of liquids to determine the densities of different liquids and compare them to the densities of objects calculated in Part 1. The groups then carefully test their calculations by layering the...
NOAA
Mapping the Deep-Ocean Floor
How do you create a map of the ocean floor without getting wet? Middle school oceanographers discover the process of bathymetric mapping in the third installment in a five-part series of lessons designed for seventh and eighth graders....
Teach Engineering
Determining Densities
Don't be dense—use a robust resource. The second installment of a five-part Floaters and Sinkers unit has learners determine the densities of several objects. As part of the activity, they learn the displacement method for finding...
Howard Hughes Medical Institute
Patterns in the Distribution of Lactase Persistence
We all drink milk as babies, so why can't we all drink it as adults? Examine the trend in lactase production on the world-wide scale as science scholars analyze and interpret data. Groups create pie charts from the data, place them on a...
Teach Engineering
All Fats Are Not Created Equal
Apply robotics to connect physical properties to chemical properties. Future engineers use robots to determine the melting points of various fats and oils. The robots can do this by measuring the translucency of the fats as they heat up.
McGraw Hill
Neutron Stars Interactive
The universe is full of sources of energy. Explore the energy of pulsars with your classes through a simulation. An interactive lesson allows learners to manipulate the angle of rotation of both the earth and the pulsars. A real-time...
Curated OER
Drama from Animal Characters
Learn about animal habitats, characteristics, and writing in a different perspective. The class composes a narrative from the perspective of a fresh water animal, they include a problem and the animal's reaction to the problem. The...
Curated OER
Plotting the Ocean Floor
Fourth graders plot points on a graph, connect the dots to make the ocean floor profile and label the topographical features. They utilize a worksheet and a website imbedded in this plan to plot the ocean floor.
Curated OER
Plotting Earthquakes
Students, after plotting earthquake locations on the map, should correctly; identify the pattern of earthquake locations and identify the ring of fire.
Curated OER
Graph Sketches
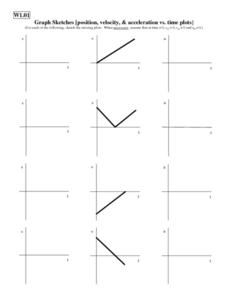
In this graphing worksheet, students use velocity vs. time graphs to create speed vs. time and acceleration vs. time graphs. Students create 24 graphs.


