Curated OER
Money Math: Lessons for Life
Students develop a budget for a college student using all of the influences that the student would have. In this budgeting lesson plan, students use real life examples to create a budget spreadsheet. Students read and study sample...
Curated OER
State Economy Chart
Fifth graders research and record statistics on the economy of an assigned state. They create a spreadsheet in Excel to report the data and a 3D Pie graph using the Chart Wizard in Excel to represent their states' data.
Curated OER
Weather
Students create a spreadsheet and chart using data collected. In this weather lesson plan, students select five cities from their state, including the city they live in. Students take daily temperature readings from all five cities. ...
Curated OER
A Line Graph of the Ocean Floor
Students develop a spreadsheet and import the information into a line graph. In this spreadsheet and line graph lesson plan, students develop a spreadsheet of ocean depths. They import the information into a word processed document. They...
Curated OER
Which Amusement Park Would You Choose?
Students analyze data related to amusement parks and create a spreadsheet to display the data. They read the data and predict which amusement park they think is safer, create a spreadsheet and graph, and write a proposal based on their...
Curated OER
BRIDGING THE GENERATION GAP
Students create a hypothesis about the attitudinal differences between generations, test their hypothesis with a survey, chart their findings, and present their answers to the class.
Curated OER
Basic Excel
Students explore basic Excel spreadsheets. In this spreadsheet lesson plan, students enter Alaska weather information and perform calculations. Students title the columns on the spreadsheet and format the cells. Students complete...
Curated OER
Correlation of Variables by Graphing
Middle and high schoolers use a spreadsheet to graph data. In this graphing lesson, learners determine how two parameters are correlated. They create a scatter plot graph using a computer spreadsheet.
Curated OER
Information Shuffle
Gather some information, print it onto sentence strips, and then have your class physically shuffle the cards to better understand the importance of organizational patterns in writing. Middle school learners examine information for a...
Code.org
Cleaning Data
"Clean the data!" "I did not know it was dirty." Introduce your class to the process of cleaning data so that it can analyze it. Groups work through a guide that demonstrates the common ways to filter and sort data. Pairs then...
Curated OER
Historical Population Changes in the US
High schoolers conduct research on historical population changes in the U.S. They conduct Internet research on the Historical Census Data Browser, create a bar graph and data table using a spreadsheet program, and display and interpret...
Curated OER
Discovering Pi
Define terminology related to a circle. Practice accuracy in measuring and then create a spreadsheet based on data collected from solving for parts of a circle. Groups can have fun analyzing their data as it relates to Pi.
Curated OER
All The Bell & Whistles
Young adults are so eager to get that first cell phone. And, cell phones have so many cool extras! Learners conduct real-life research to determine which cell phone carrier offers the best deals on things like wall paper, ringtones, and...
Curated OER
How Credit Card Interest Works
Students experiment with an Excel spreadsheet model that demonstrates the effects of interest on payments. They calculate actual costs, interest paid, and time necessary to pay off credit purchases and draw conclusions about the...
Curated OER
Forces of Flight - Lift
Young scholars design and test paper airplanes to understand the concept of lift and how it affects flight. This technology-based Science lesson plan is excellent for use with upper-elementary and middle-level learners and uses...
Curated OER
Birds, Fractions and Percentages
Students study fractions, percentages, spreadsheets, and computers by watching and recording the number of species of birdsseen. They create a spreadsheet to record the results of their one month study.
Curated OER
Math Hunt
Go on a scavenger hunt around your school to find evidence of math. Investigate different areas of your school for patterns, fractions, and different geometric shapes. Finally, create a spreadsheet and plot the data you've collected.
Curated OER
How Tolerant Are Kids in Your School?
Learners graph results of a survey about attitudes and tolerance in their school. They discuss the social climate of their school. Students complete a questionnaire, and tabulate the raw data from their class. They create a bar graph...
Curated OER
Counting Coins
Second graders identify a quarter, dime, penny, nickel, and dime. They match the coin with it's monetary value, collect data on excel spreadsheet, and create a graph in Excel. Students participate in group activities.
Curated OER
What Goes Up Must Come Down!!
Fifth graders look at actual sunrise and sunset times for their hometown to determine a pattern in the amount of daylight. They collect their data in Excel and create a chart to help them identify the pattern, then write an explanation...
Curated OER
"Living in the Limelight The Universal Dream"
Students, using Leo's Lyrics, investigate common themes in popular music. They create a Microsoft Excel spreadsheet that analyzes their findings along with a 200 word paragraph stating their observations, conclusions and hypotheses about...
Curated OER
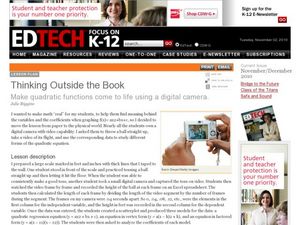
Thinking Outside the Box
Now this lesson sounds fun! Students throw a ball, film it as it soars through the air, and use a spreadsheet to collect data. A scatterplot is created to produce a quadratic regression equation, an equation in vertex form, and an...
Howard Hughes Medical Institute
Lesson 8: WildCam Gorongosa Data Analysis
How do scientists analyze data to get a specific answer to a question? The final chapter in an eight-part series of activities centered around Gorongosa National Park encourages scholars to dig deeper into the scientific process. After...
Curated OER
Conversation Heart Graphing
Sixth graders review the different types of graphs (bar, line, pictograph) They predict the data set they can garner several boxes of conversation hearts. Students record their data using an Excel spreadsheet. They create a graph based...


