Curated OER
Using Bar Graphs to Understand Voting Patterns
Bar graphs are used as a way to study voting patterns in the United States. A variety of statistical data is presented in the graphs, and pupils must interpret the data in order to make a report to the class. Three excellent graphs,...
Curated OER
Graphing Canada
Students research a province of Canada choosing a question to investigate. They record their information on a worksheet that is provided and complete a graph. They present their bar graphs to the class.
Curated OER
Which Holiday Parades Have You Seen?: Graph
First graders ask their classmates which holiday parades they have seen and record the responses to complete the graph. A basic lesson, but great for teaching or strengthening graphic skills.
Curated OER
Trash to Gas
Students experiment with biomass materials as alternative energy sources. In this biomass material lesson, students participate in an experiment with cow manure to determine how it can be used as an energy source. They record their data...
Curated OER
Which National Symbol Would You Most Like To Visit?: Graph
In this national symbols bar graph worksheet, students will ask their classmates which national symbol they would most like to visit and record the responses to complete the graph. There are 5 symbols from which to choose.
Curated OER
St. Patrick's Day Lucky Charms Sort Bar Graph
In this elementary data collection and graphing learning exercise, students paste the correct cereal pieces to match the words at the bottom of the bar graph. They count the items and fill in the graph in this St. Patrick's Day themed...
Curated OER
What is Your Favorite Christmas Light Color? Bar Graph Recording Sheet
In this opinion bar graph worksheet, students receive a number and record their preference of Christmas light color in the worksheet. They examine the colored boxes at the bottom of the page to make their choice. There are no directions...
Curated OER
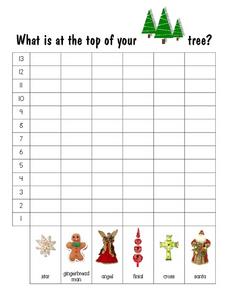
What Is At the Top of Your Christmas Tree? Bar Graph Recording Sheet
In this Christmas bar graph recording worksheet, students receive a number and record what is placed at the top of their Christmas tree. They chose between a star, a gingerbread man, an angel, a finial, a cross or a Santa figure. There...
Curated OER
Collecting Data to Learn About the People Around You
Human graphs, anyone? Did you eat fruit today? What is your favorite costume? Have your K – 6 learners graph the responses. Early elementary grades may count and compare while upper grades compare responses of different groups or make...
Kid Zone
Groundhog's Day Graphing
This Groundhog's Day, challenge scholars to predict, estimate, tally, and graph in a weather-themed lesson in which class members play the role of the groundhog to forecast the weather come February second.
Wise Owl Factory
Mother's Day Graphing
A Mother's Day-themed math activity reinforces counting and graphing. Scholars count pictures and roll a festive die then graph their findings using a bar graph.
Curated OER
Graphing the Annual Food Drive
Learners graph the number of items contributed to the food drive. They compare daily results to other days or to an overall goal and answer questions based on the graph.
School Sparks
Christmas Worksheets for Santa's Little Helpers
Just because children aren't in the classroom over winter break, doesn't mean that learning has to stop. Intended as a resource for parents, this eBook provides Christmas-themed worksheets and activities that engage children in...
Curated OER
Horizontal Bar Graph: Changes in Nebraska Population
In this bar graph learning exercise, learners learn about the changes in Nebraska's population from 1880 to 2000 by studying a bar graph. Students answer 7 questions about the graph.
Curated OER
Graphic Accounts
Students identify the use of different types of bar graphs. They analyze graphs used in the New York Times to compare the estimated cost of the war in Iraq to other hypothetical expenditures and reflect on how graphs can help illustrate...
Curated OER
The constitution and Our Republic
Young scholars record and interpret data. In this constitution lesson, students discuss voting and making bar graphs. Young scholars practice voting and do a bar graph activity. Students make visual representations of votes on the board.
Curated OER
Endangered Species
For this geography worksheet, students identify how to manipulate data on a range of endangered species. They create a bar graph of endangered animals from Africa, Asia, Australia, North America, or South America. Students use a...
Curated OER
Statistics Canada
Students practice using graphing tools to make tables, bar charts, scatter graphs, and histograms, using census data. They apply the concept of measures of central tendency, examine the effects of outliers. They also write inferences and...
Museum of Tolerance
Where Do Our Families Come From?
After a grand conversation about immigration to the United States, scholars interview a family member to learn about their journey to America. They then take their new-found knowledge and apply their findings to tracking their family...
Yummy Math
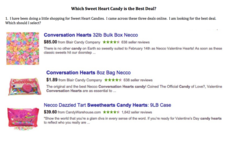
Which Sweet Heart Candy Is the Best Deal?
Get the most Valentine's candy for your money with a fun math activity! After examining three deals for buying candy hearts in bulk, young mathematicians decide which deal is the best and use bar graphs to demonstrate their claim. They...
US Department of Commerce
Immigration Nation
People come and people go. Given tabular census data on the annual number of immigrants from four different regions of the world between 2000 and 2010, pupils create double bar graphs and line graphs from the data. They analyze their...
PBS
The Lowdown — U.S. Gun Homicides: Visualizing the Numbers
Is gun violence a big issue in America? Pupils explore gun deaths by type, race, and age group in a Math at the Core: Ratios interactive. The class tries to determine whether America is a safe place to live and use bar graphs and pie...
Curated OER
Tallest Waterfalls of the World: Graph It
In this graphing worksheet, 6th graders graph the tallest waterfalls of the world according to which region they are located in. Students then answer questions related to their graph information.
Other popular searches
- Skittles Bar Graph
- Double Bar Graphs
- Bar Graphs Pictographs
- Histogram and Bar Graph
- Bar Graphs and Histograms
- Bar Graph Problem Solving
- Favorite Food Bar Graph
- Bar Graphs Histograms
- Interpreting Bar Graphs
- Bar Graphs for Birthdays
- Bar Graph Worksheet
- Bar Graphs and Charts


