Curated OER
Gender and Income
Students investigate Income and gender preference. For this statistic lesson, students collect data of Income to see if one gender makes more than the other. Students examine the data and draw conclusions.
Curated OER
How Much Is Too Much?
Students examine population growth and collect data. In this statistics lesson plan, students create a scatter plot to represent the different species found in the water and are being harvested. They graph their data and draw conclusion...
Curated OER
Mythology Spreadsheet
Learners read a large variety of myths and discuss the characters and their attributes found in mythology. Then they identify and learn to set up an appropriate spreadsheet program. Students also enter the data to the class spreadsheet...
Curated OER
One Plus One Makes New
Students discover the properties of matter and how they change when composite materials are produced. For this informative lesson students write up a question and procedure to an experiment then analyze and draw conclusions based...
Curated OER
Hurricanes and Climate
Students investigate maps and data to learn about the connections between hurricanes and climate. In this exploratory lesson students describe and graph the 6 regions where hurricanes happen and discuss how hurricanes have changed over...
Curated OER
Role-Playing Jean Talon
Students explore New France. In this New France instructional activity, students examine census data compiled by Jean Talon in 1665 and 1666. Students take on the role of Talon trying to convince the King of France to increase his...
Curated OER
Paper Gliders
Sixth graders study friction and drag. In this science activity, 6th graders use different models of gliders and test to see which of the gliders fly the farthest. Students analyze their data and construct a graph.
Curated OER
Permafrost
Students use a thermometer to analyze soil temperature data to determine which soil sample is normal, and which one is permafrost. For this permafrost lesson plan, students participate in a hands on activity where they identify the...
Curated OER
Significant Science: Statistics for Planet Earth
Ninth graders discover how statistics are used to interpret results of scientific experiments. Students write hypotheses and test the hypotheses by collecting data and organizing the data. Students graph their data to produce a visual....
Curated OER
Earthquake on the Playground
Students investigate earthquakes by examining chart data. In this disasters lesson, students identify the waves that are recorded when an earthquake arises by reading sample graphs in class. Students participate in an...
Curated OER
Hand Sensitivity
Students experiment with the sense of touch. In this tactile lesson plan, students determine the most sensitive area of the hand. Students experiment by describing objects through touch only. Students compare the amount of sensory data...
Curated OER
Scientific Inquiry
Young scholars investigate the general geology, biology, and chemistry of Seneca Lake. They study how to use scientific instruments on the research vessel. They explain how the data they gather will be used by scientists and develop a...
Curated OER
Bell Curve
Students explore averages by completing a data analysis activity. In this bell curve lesson, students measure different food items and plot their measurements on a X and Y axis. Students create bell curves around the average weight or...
Curated OER
Combinations and Permutations
Fifth graders investigate the concepts of combinations and permutations using probability. They practice calculations using probability to measure the outcomes. Students demonstrate how to organize and categorize the data.
Curated OER
Patterns, Relations, and Functions
Students investigate the patterns of different data sets of numbers. They use critical thinking skills in order to find the missing numbers in any given set. This instructional activity helps to develop the skill of number sense.
Curated OER
Paws in Jobland: Lesson Plan 35 - Catch of the Day
Young scholars study information for fish farm workers given in the form of a chart, in order to practice interpreting data while learning about the career of a fisherman. In this data interpretation lesson, students read the chart to...
Curated OER
Probability
Third graders conduct experiment, collect data, predict, record, and discuss outcomes, and analyze data for probability.
Curated OER
Weather Instrument Data Information
In this science worksheet, young scholars are given the task of recording weather information twice daily using the homemade weather instruments.
Curated OER
Graphing Climate Information
Seventh graders plot the data for the average monthly precipitation for three cities. They make a graph using a spreadsheet.
Curated OER
The Foot Book
Students use estimation and measurement skills to make predictions and solve problems about length. They also analyze data presented to calculate ratios and percents.
Curated OER
Sorting and Graphing Animals
Students inquire about animals using SIRS Discoverer or eLibrary Elementary. In this organizing data lesson, students sort pictures of animals in various ways and develop graphs. Students locate a mammal, reptile, fish, insect or...
Curated OER
Give Me a Minute
Students categorize data. In this categories instructional activity, students get a specific topic and they have a minute to list as many items that fit under this topic. They compare lists with a classmate and discuss whether all...
Curated OER
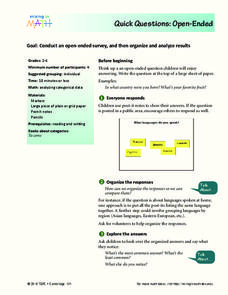
Quick Questions: Open-Ended
Students conduct an open ended survey and analyze the data they found. In this open-ended survey lesson plan, students ask others their open ended questions and then organize their results based on the most common, least common, and...
Other popular searches
- Data, Census, & Statistics
- Data Analysis Pictograph
- Data Table
- Categorical Data
- Data Analysis Lesson Plans
- Data Management
- Data Analysis Graphing
- Data Analysis and Graphs
- Science Fair Project Data
- Data Display
- Organizing Data
- Census Data


