Curated OER
Looking for More Clues
Fifth graders explore how to collect data and display it on a bar and circle graph.
Curated OER
Designing a Study
Students explore features to consider when designing a scientific study. In this science research lesson, students examine different methods of data collection and consider which method would be appropriate for determining how many types...
Curated OER
Valentine Candy Count
Young scholars analyze a bag of Valentine candy to create a graph. In this graphing lesson, students make predictions, sort by color, record data and make a graph. Young scholars discuss results and make generalizations. Students...
Curated OER
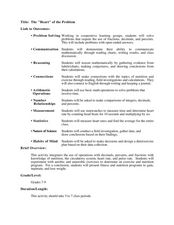
The "Heart" of the Problem
Students explore mathematical operations while studying nutrition. In this physical fitness lesson, students explore calories, pulse rate, and the circulatory system. Students use mathematical data to create a healthy physical fitness...
Curated OER
Make a Graph
In this graphing worksheet, 1st graders use given data to create a graph and answer questions. In this problem solving worksheet, students solve five problems.
K12 Reader
Showing Data on a Graph
Here's a worksheet that not only introduces kids to graphing, but also is designed as a reading comprehension activity. After reading the article about graphing, kids respond to a series of questions based on the article.
Curated OER
Voter Turnout
Explore politics by analyzing the voting process. Pupils discuss the purpose of casting votes in an election, then examine graphs based on the data from a previously held election's turnout. The lesson concludes as they answer study...
K20 LEARN
Something's Rotten In The City Of Verona: Information Literacy
Data is a powerful tool that your class can use for both good and evil! Help your classes become knowledgeable consumers of information through a game-based exploration. Learners examine a method of determining the reliability of a...
Baylor College
Body Strength
Your young learners will discover how muscular strength and endurance can increase with this truly hands-on activity! Beginning by writing an acrostic for the word strength, class members then engage in tracking their ability to squeeze...
Curated OER
Collecting My School Family Data
Young scholars are tasked with collecting data on their school. In groups, they collect data on various aspects of school life along with social and economic backgrounds and charactertics of their hair and eye color. They draw two...
Curated OER
Misleading Graphs
Students explore number relationships by participating in a data collection activity. In this statistics lesson, students participate in a role-play activitiy in which they own a scrap material storefront that must replenish its stock....
Curated OER
Motion on an Inclined Plane
In this physics worksheet, students model the acceleration, velocity, and position of a cart moving up an inclined plane. They take data and determine a pattern in the data. Students also describe their findings and create an illustration.
Curated OER
Scatterplots
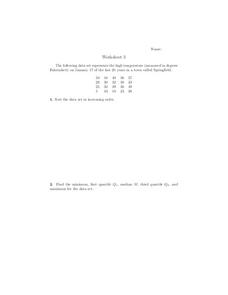
For this scatterplots worksheet, 9th graders solve and complete 6 different word problems with different sets of data. First, they sort the data set in increasing order and find the minimum, first quartile, median, third quartile, and...
Curated OER
Statistical Pictures of School and Life
Pupils explore how mathematical data is used to summarize and illustrate everyday life. They apply mathematical concepts and skills to analyze data. Students conduct a five question survey of 50 people or more and graph the data.
Curated OER
Tables, Charts and Graphs
Students examine a science journal to develop an understanding of graphs in science. In this data analysis lesson, students read an article from the Natural Inquirer and discuss the meaning of the included graph. Students create a...
Curated OER
Memory Game
Young scholars create cards for a memory game by entering data into a spreadsheet that is then merged into a word processing document. Tutorials are available through links on the activity page.
Curated OER
Mythology Spreadsheet
Students read a large variety of myths and discuss the characters and their attributes found in mythology. Then they identify and learn to set up an appropriate spreadsheet program. Students also enter the data to the class spreadsheet...
Curated OER
Earthquake on the Playground
Students investigate earthquakes by examining chart data. In this disasters lesson, students identify the waves that are recorded when an earthquake arises by reading sample graphs in class. Students participate in an earthquake...
Curated OER
Bell Curve
Students explore averages by completing a data analysis activity. In this bell curve lesson, students measure different food items and plot their measurements on a X and Y axis. Students create bell curves around the average weight or...
Curated OER
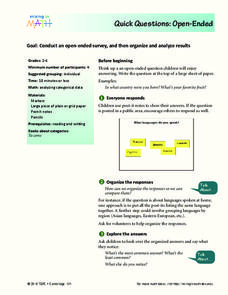
Quick Questions: Open-Ended
Students conduct an open ended survey and analyze the data they found. In this open-ended survey lesson plan, students ask others their open ended questions and then organize their results based on the most common, least common, and...
Curated OER
Ramp Builder
Students plan and build a ramp designed for maximum distance a car can travel. In this physics and data collection math lesson, students work in groups to design a ramp using various household materials. Students test small cars on their...
Pennsylvania Department of Education
Use Order of Operations to Evaluate Expressions—No Grouping Symbols
Students identify and explain different types of data collection and graphs. In this graphs and data collection lesson, students record their observations of a variety of data collection tools and graphs displayed in the room. Students...
Curated OER
Organizing and Interpreting Data
For this organizing and interpreting data worksheet, students solve and complete 10 different problems related to reading various data tables. First, they complete the 3 charts shown with the correct tally amount, frequency amount, and...
Curated OER
Independent Investigation
In this science instructional activity, learners write what they want to discover and identify what they feel will happen. Then they design an experiment and write the steps for it in the space provided. Students also create a data table...
Other popular searches
- Data, Census, & Statistics
- Data Analysis Pictograph
- Data Table
- Categorical Data
- Data Analysis Lesson Plans
- Data Management
- Data Analysis Graphing
- Data Analysis and Graphs
- Science Fair Project Data
- Data Display
- Organizing Data
- Census Data


