Centers for Disease Control and Prevention
Major Disparities in Adult Cigarette Smoking Exist Among and Within Racial and Ethnic Groups
Data indicates that some racial groups smoke more than others, and that with that racial group, there are smaller groups whose smoking habits vary as well. Secondary learners read a graph that details the differences between the Asian...
PBS
The Lowdown — Living Wages in CA: Ratio and Rate in the Real World
How much money is enough money? Future wage earners explore the minimum hourly wage and then use it to calculate monthly and yearly earnings. They use an interactive to consider living costs and determine whether earning a minimum wage...
Next Gen Personal Finance
Next Gen Personal Finance: Managing Credit Data Crunch
Data Crunches feature one chart or graph followed by five scaffolded questions to guide students through analyzing the data and drawing conclusions. These sets of data help students understand financial concepts.
Next Gen Personal Finance
Next Gen Personal Finance: Saving Data Crunch
Data Crunches feature one chart or graph followed by five scaffolded questions to guide students through analyzing the data and drawing conclusions. These sets of data help students understand financial concepts.
Next Gen Personal Finance
Next Gen Personal Finance: Checking Data Crunch
Data Crunches feature one chart or graph followed by five scaffolded questions to guide students through analyzing the data and drawing conclusions. These sets of data help students understand financial concepts.
Next Gen Personal Finance
Next Gen Personal Finance: Career Data Crunch
Data Crunches feature one chart or graph followed by five scaffolded questions to guide students through analyzing the data and drawing conclusions. These sets of data help students understand career concepts.
Next Gen Personal Finance
Next Gen Personal Finance: Investing Data Crunch
Data Crunches feature one chart or graph followed by five scaffolded questions to guide students through analyzing the data and drawing conclusions. These sets of data help students understand investment concepts.
Next Gen Personal Finance
Next Gen Personal Finance: Types of Credit Data Crunch
Data Crunches feature one chart or graph followed by five scaffolded questions to guide students through analyzing the data and drawing conclusions. These sets of data help students understand credit concepts.
Next Gen Personal Finance
Next Gen Personal Finance: Insurance Data Crunch
Data Crunches feature one chart or graph followed by five scaffolded questions to guide students through analyzing the data and drawing conclusions. These sets of data help students understand insurance concepts.
Next Gen Personal Finance
Next Gen Personal Finance: Taxes Data Crunch
Data Crunches feature one chart or graph followed by five scaffolded questions to guide students through analyzing the data and drawing conclusions. These sets of data help students understand tax concepts.
Next Gen Personal Finance
Next Gen Personal Finance: Financial Pitfalls Data Crunch
Data Crunches feature one chart or graph followed by five scaffolded questions to guide students through analyzing the data and drawing conclusions. These sets of data help students understand financial concepts.
Next Gen Personal Finance
Next Gen Personal Finance: Budgeting Data Crunch
Data Crunches feature one chart or graph followed by five scaffolded questions to guide students through analyzing the data and drawing conclusions. These sets of data help students understand financial concepts such as budgeting.
Next Gen Personal Finance
Next Gen Personal Finance: Paying for College Data Crunch
Data Crunches feature one chart or graph followed by five scaffolded questions to guide students through analyzing the data and drawing conclusions. These pertain to paying for college.
Other
U. Of Wisconsin: Formulating Statistical Questions and Collecting Data
This slideshow gives a detailed explanation of the characteristics of statistical questions and how they differ from other types of questions, the types of studies, and the methods for collecting data. It describes the case of Clever...
NOAA
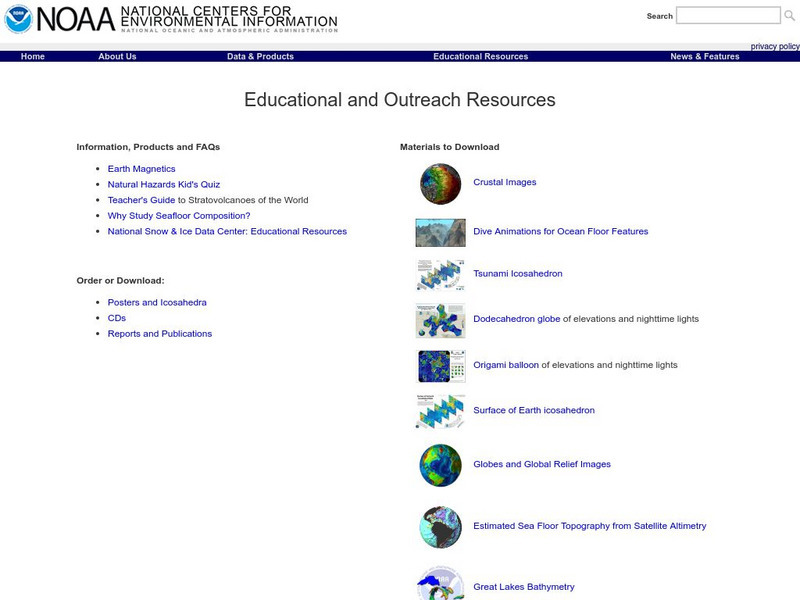
Noaa: Ngdc: Images, Visualizing Data
The National Geophysical Data Center has transformed extensive ocean research into colorful video, 3D maps, charts posters and more! This site starts off with a film clip of a dive into the Marianas trench and then lead you to other...
Sophia Learning
Sophia: Continuous Data Tutorial
Continuous data is defined and explained in this video.
Sophia Learning
Sophia: Continuous Data
Continuous data is defined and examples are given in this lesson.
Sophia Learning
Sophia: Continuous vs Discrete Data
Explore continuous and discrete data and when to use one over the other.
Sophia Learning
Sophia: Continuous vs Discrete Data
Explore continuous and discrete data and determine when to use each one.
Sophia Learning
Sophia: Discrete Data
Explore the term discrete data and look at examples for further explanation.
Federal Trade Commission
Federal Trade Commission: Infographic: Equifax Data Breach Settlement
Infographic displays information about the Equifax data breach settlement that provided up to $425 million to help people affected by the data breach.
NOAA
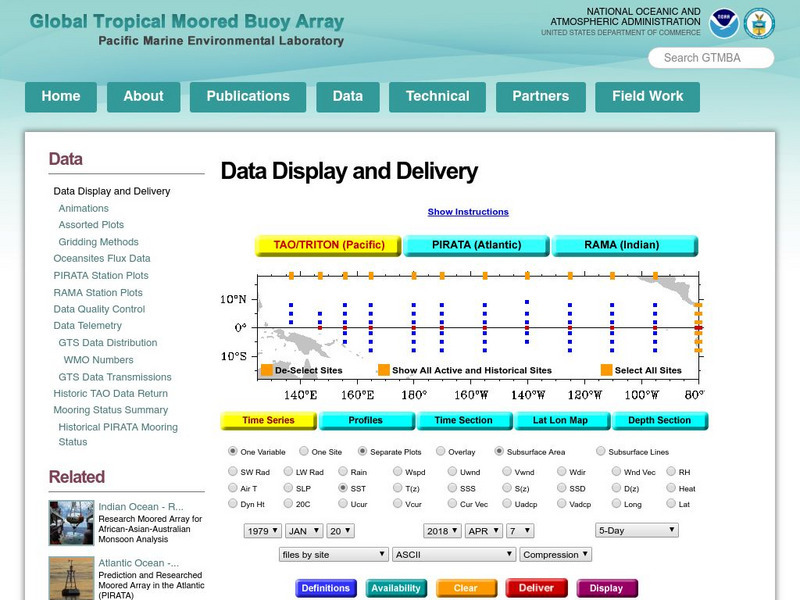
Noaa: Pmel: Tropical Atmosphere Ocean Project: Tao/triton Data Display
Resource features real-time data from moored ocean buoys for improved detection, understanding, and prediction of El Nino and La Nina with diagrams.
Other
Hubspot: Data Visualization 101: How to Design Charts and Graphs
Your data is only as good as your ability to understand and communicate it, which is why choosing the right visualization is essential. Learn more in this guide.
Other
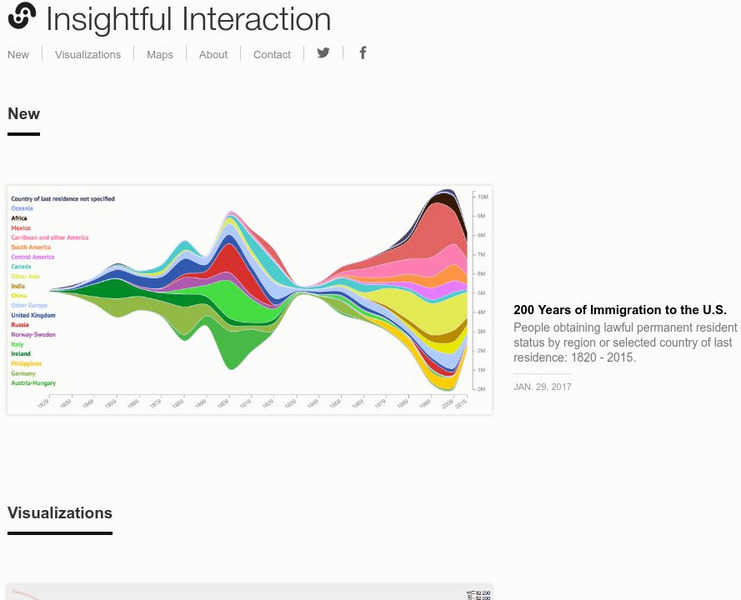
Insightful Interaction: Visualizations
A collection of interactive visualizations that were produced through analysis of economic, political, and market research data. Topics are diverse, e.g., military spending and trade, immigration, consumer spending, crime, unemployment,...
Other popular searches
- Data, Census, & Statistics
- Data Analysis Pictograph
- Data Table
- Categorical Data
- Data Analysis Lesson Plans
- Data Management
- Data Analysis Graphing
- Data Analysis and Graphs
- Science Fair Project Data
- Data Display
- Organizing Data
- Census Data

