Curated OER
Get a Half-life!
Students use m&m candies as their sample set. They begin by counting the total number of candies to determine their sample size. Students put the candies into a cup and shake them gently before pouring them onto a paper plate. Count...
Curated OER
Understanding Equations of Functions
Students write equations for different functions. In this algebra lesson plan, students observe data and find the function that goes along with that data. The identify the line of best fit.
Curated OER
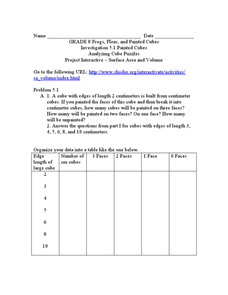
Analyzing Cubes
In this analyzing cubes worksheet, 9th graders solve and complete 6 different types of problems. First, they organize the given data into the table provided. Then, students study the patterns in the table and tell whether the pattern of...
Curated OER
Conductivity of salt Solutions
Students investigate the concentration level of solutions. In this math/science activity, students identify three different ionic compounds. They predict the conductivity of each using their collected data.
Curated OER
Carnival Tickets-Graphing
In this graphing instructional activity, students first make a line plot with given information about tickets earned for a school carnival, then answer 3 related questions.
Curated OER
A Second Visit To Old Sturbridge Village-The Story Tour
Students conduct research on 1830s families and early New England culture. They conduct research on the Old Sturbridge Village website, participate in an online chat with a costumed interpreter, and continue to develop possible plots to...
Curated OER
Journal of the Stars
Students receive balloons representing the "Life Cycle of the Stars." As the attached script is read, students follow the directions for the color of balloon they are given. Students chart the results for their star. They plot data from...
Curated OER
Linear Functions
Students solve and graph linear equations. In this algebra activity, students collect data and plot it to create a linear function. They identify the domain and range of each line.
Curated OER
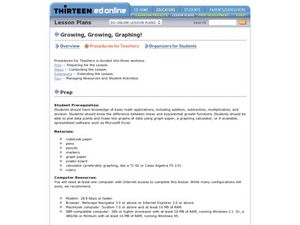
Linear and Exponential Growth
Young scholars explore the concept of linear and exponential growth. In this linear and exponential growth lesson, students collect data about China's population. Young scholars model the data to determine if it is linear or exponential.
Curated OER
Modelling Periodic Phenomena
In this Pre-calculus/Trigonometry worksheet, students determine the trigonometric function that best models the given data. The eight page worksheet contains explanation, examples, and twenty-one problems. Answers are not included.
Curated OER
Sizing Pumpkins
Fifth graders study the sizes of pumpkins. They measure and record the diameters of pumpkins. They create five subtraction problems and solve them. They weigh their pumpkins, record the data and select two pumpkins to make a graph of...
Curated OER
When Ants Fly
Here is a great lesson on constructing line graphs. Learners identify common characteristics of birds, ants common needs of all living things. They also write a story from the perspective of an ant or a bird that has lost its home and...
Curated OER
MAP Practice
For this geometry worksheet, students create circle, line and bar graphs using different comparisons of events. There are 24 questions with an answer key.
Curated OER
More Students Taking Online Courses
In this graph worksheet, students study a bar graph that shows the number of college students taking at least one online course. Students answer 4 problem solving questions about the data on the graph.
Curated OER
Probability Distributions
Students collect and plot data on a graph. In this statistics lesson plan, students analyze the distribution of a sample and predict the outcome. They find the line of best fit and discuss what would make the sample larger.
Curated OER
Specific Heat and Insulation
Students measure the air and soil temperatures at designated times. They graph the temperatures of each on one piece of graph paper with different colors. Students compare the information for the two line plots and analyze their results...
Curated OER
Looking Normal
Students identify the shape of a function. In this statistics instructional activity, students plot the data collected. They analyze their data for positive, negative or no correlation. They find the line of best fit.
Curated OER
Midterm 1 Exam: Statistics
In this statistics worksheet, students determine the mean, variance, standard deviation and median of given statistical data. They organize data, create box-and-whisker plots and identify outliers. This nine-page worksheet contains 7...
Curated OER
Distance in Coordinate Geometry
Learners analyze distance and graphing. In this geometry lesson, students work problems on a coordinate grid calculating the distance. They apply the Pythagorean Theorem to their data and answer.
Curated OER
Best Guesser
Fifth graders develop strategies for estimating ages, and illustrate results by graphing and interpreting scatter plots to compare x and y coordinates.
Curated OER
Where's the Beach?
Students use beach profile data to analyze how erosion and sediment transport changed seashore slopes. In this geology lesson, students plot the data provided and analyze erosion patterns. They also assess coastal erosion management...
Curated OER
Charting Attendance Rate of Busch Gardens
Sixth graders, in groups, are given different parts of the whole project. They use information from Busch Gardens to explore line graphs, averages, and other math vocabulary.
Curated OER
Plotting Earthquakes
In this earthquakes worksheet, students access a website to gather information about the magnitude and location of earthquakes for 5 days. Then students complete 7 short answer questions.
Curated OER
Graphing Scatterplots
Students examine scatterplots and determine the equation of a line using the slope-intercept method. Students interpret graphs, draw inferences, and sketch a curve of best fit for the graph. Based upon patterns in the graphs, students...


