Curated OER
Obstacles to Success: Misleading Data
Eleventh graders explore how data reported by country agencies can mislead the public intentionally or unintentionally. For this Cross Curricular activity, 11th graders analyze charts and graphs in order to draw conclusions. Students...
Albert Shanker Institute
Economic Causes of the March on Washington
Money can't buy happiness, but it can put food on the table and pay the bills. The first of a five-lesson plan unit teaches pupils about the unemployment rate in 1963 and its relationship with the March on Washington. They learn how to...
Curated OER
Will There Be a White Christmas This Year?
Students examine historical weather data, and create map and color key that illustrates the likelihood of a white Christmas in different locations across the United States.
Curated OER
Halloween Graphitti
Students complete multi-curricular activities in a Halloween themed instructional activity. In this Halloween instructional activity, students examine newspaper ads to find prices of pumpkins and use them to complete a stem and leaf...
National Council of Teachers of Mathematics
National Debt and Wars
Take a functional approach to the national debt. Learners collect information about the national debt by decade and plot the data. They determine whether an exponential curve is a good fit for the data by comparing the percent changes...
Curated OER
Census Data and New Hampshire History
Students graph the population growth of New Hampshire using historical census data.
Curated OER
Earth's Warming Climate: Are We Responsible
Students examine the atmospheric data for CO2. In this web-based atmospheric lesson, student follow instructions to examine and plot on-line scientific data about the CO2 levels in our atmosphere and analyze the changes found in the data.
Curated OER
Lesson 3 Activity 1: On the Trail of Knowledge
Students plot the earthquake epicenter data on the base map of the North Atlantic ocean floor using different symbols or colors to characterize different values.
Curated OER
Cities
Students examine U.S. Census figures. In this urban centers lesson, students compare city populations across the span of 50 years. Students create line graphs based on the data.
Curated OER
A Second Visit To Old Sturbridge Village-The Story Tour
Students conduct research on 1830s families and early New England culture. They conduct research on the Old Sturbridge Village website, participate in an online chat with a costumed interpreter, and continue to develop possible plots to...
Curated OER
Shaky New Zealand
Students explore Earth science by building a model in class. In this tectonic plate lesson, students identify the impact tectonic shifts have on humans and animals and where the plates and faults lie under New Zealand. Students examine...
Curated OER
Clouds and Solar Radiation
Students use satellite imaging and Mesonet solar radiation maps to answer questions given to them by the teacher and look for differences and similiarities in the data.
Curated OER
Excel temperature Graphs
Students gather data about the weather in Nome, Alaska. In this Nome Temperature lesson, students create an excel graph to explore the weather trends in Nome. Students will find the average weather and add a trend line to their graph.
Curated OER
In the Wake of Columbus
Students explore how the population decreased in native cultures.
Curated OER
Moving On Up!
Students complete a game-like simulation to determine a career and salary. In groups, they collect information and decide what is the "best" city in which to live. They create a monthly budget for their "best" city based on salary from...
Curated OER
Do the Elephants Need Sunscreen? A Study of the Weather Patterns in Etosha
Students analyze the weather patterns in Namibia. They create a graph of the yearly temperatures and use the internet to gather information. They discuss how the weather goes in cycles in the area.
Curated OER
What did I find?
Students excavate an artifact. In this archaeology lesson, students get a bucket filled with dirt and a broken up artifact. They work in groups to take it out and to find what its purpose was.
Curated OER
Whose Breakfast isn't for the Birds?
Students explore coffee production. In this cross-curriculum rainforest ecology lesson, students research regions where coffee comes from and investigate how the native birds in the rainforest are effected by coffee...
Curated OER
Around the World
Students explore ways people from around the world are like them. They discuss how geography affects the way people live and work and how culture affects a person's day to day life. Students give a presentation over a chosen country to...
Curated OER
Tomb Explorer/Temple Explorer
Fourth graders build an explorer vehicle which they program through an obstacle course to enter the tomb or temple to discover artifacts.
Curated OER
A Statistical Look at Jewish History
Students complete their examination over the Jewish Diaspora. Using population figures, they discover the importance of percentages in exploring trends. They use their own ethnic group and determine how it is represented in the United...
Curated OER
Immigration Graphs
Fourth graders study immigration. In this graphing lesson, 4th graders make a population graph of people who have immigrated to Indiana.
Curated OER
A Bird's Eye View of our 50 States
Third graders focus on state birds as they learned absolute location (latitude/longitude) of each state, as well as their relative location (bordering states).
Curated OER
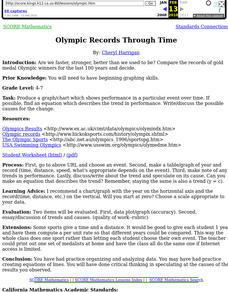
Olympic records through time
Students compare the records of gold medal Olympic winners for the last 100 years and decide if we are faster, stronger than in the past.


