Curated OER
Leveled Problem Solving: Range and Outliers
In this range and outliers learning exercise, students solve 6 word problems where they examine data then identify outliers, find the upper and lower quartile ranges, find the interquartile range and create box-and-whisker plots.
CCSS Math Activities
Smarter Balanced Sample Items: 6th Grade Math – Target J
What is the best measure of central tendency? Scholars explore mean, median, mode, range, and interquartile range to understand the similarities and differences. They display data in dot plots, histograms, box plots, and more as part of...
Curated OER
Organizing and Interpreting Data
In this organizing and interpreting data worksheet, students solve and complete 10 different problems related to reading various data tables. First, they complete the 3 charts shown with the correct tally amount, frequency amount, and...
Virginia Department of Education
Box-and-Whisker Plots
The teacher demonstrates how to use a graphing calculator to create box-and-whisker plots and identify critical points. Small groups then create their own plots and analyze them and finish by comparing different sets of data using box...
Shmoop
Box, Stem-Leaf, and Histogram
A helpful and versatile instructional activity requires young mathematicians to analyze data in order to create graphs and answer questions. Additionally, it prompts learners to find the mean, median, mode, and range of some of the data...
American Statistical Association
Bear Hugs
Scholars research arm span to determine who gives the best bear hugs. They use data from a national study to find the standard statistics for arm span. It includes mean, median, quartiles, spread, standard deviation, and more.
Curated OER
Data Analysis
Students examine techniques to represent data. In this data analysis instructional activity, students read about various ways to represent data, such as a stem and leaf diagram and calculating standard deviation. Students complete data...
College Board
2002 AP® Statistics Free-Response Questions Form B
Develop a deeper understanding of statistics. The six released free-response items from the 2002 AP® Statistics Form B involve several concepts that are currently in the regular statistics standards. Teachers see how AP® assessed the...
Curated OER
Steppin' Out
Learners are presented with the question: "Do longer legged people run faster than shorter legged people?" Students conduct an experiment, collect their data, create box and whisker plots using a computer and graphing program, and...
Curated OER
Scatterplots
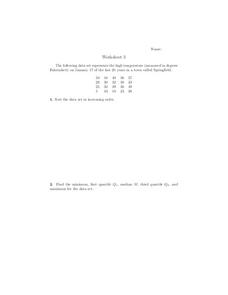
For this scatterplots worksheet, 9th graders solve and complete 6 different word problems with different sets of data. First, they sort the data set in increasing order and find the minimum, first quartile, median, third quartile, and...
Curated OER
Independent Practice 1: Box and Whisker Plot
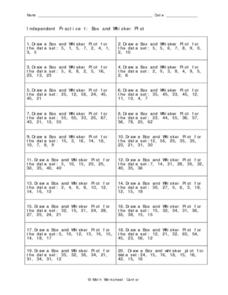
In this box and whisker plot instructional activity, students create a box and whisker plot from a given set of data. They identify the lower quartile, upper quartile, the mean, and outliers. This one-page instructional activity...
Curated OER
What is a Box and Whisker Plot?
Eighth graders explore the correct use of box and whisker plors. The times when they are appropriate to use to compare data is covered. They plot data according to statistical analysis including mean, median, and mode.
Curated OER
Being an Educated Consumer of Statistics
Students examine kinds of data used to report statistics, and create their own statistical report based on any of the four sources of media information (Internet, newspaper, TV, magazine).
Curated OER
Student Heights
Students measure the heights of their fellow classmates and create a box and whisker plot to display the data. In this measurement lesson plan, students analyze the data and record results.
American Statistical Association
Step into Statastics
Class members study the size of classmates' feet and perform a statistical analysis of their data. They solve for central tendencies, quartiles, and spread for the entire group as well as subgroups. They then write a conclusion based on...
Curated OER
Statistics: Quartiles and Percentiles
In this statistics worksheet, students examine a data set and identify the lower and upper quartiles. They determine percentile ranks of given material and compute the median of the data. This one-page worksheet contains ten problems.
Curated OER
Quiz: Percentiles and Quartiles
In this percentile and quartile worksheet, learners complete a frequency table from given data. They determine the median, upper quartile, lower quartile and percentile ranks of specified conditions. This one-page worksheet contains...
Curated OER
Measures of Central Tendency
In this measures of central tendency worksheet, students solve and complete 6 different problems. First, they count the number of items in each set of data. Then, students determine the mean, median and mode for each. In addition, they...
Curated OER
Statistics
For this statistics worksheet, students solve and complete 6 different problems that include determining various types of statistics. First, they determine the data set where the median value is equal to the mean value. Then, students...
Curated OER
Statistics
In this statistics worksheet, 9th graders solve and complete 10 various types of problems that include using different types of graphs to illustrate data. First, they determine the median score for each stem-and-leaf plot. Then, students...
Curated OER
The Statistics of Shoes
Students open a blank spreadsheet and format it for a class survey about the number of shoes owned by the men and women in the class. They enter the data before finding the mean, median, mode, quartiles, variance, and the standard...
US Department of Commerce
Does the Percentage of People Who Walk to Work in Cities Vary with Population Size?
To walk or not to walk? Pupils create box plots comparing the percentage of residents who walk to work in large, medium, and small cities. Using the box plots, class members compare the data that reflects available statistics. Scholars...
Curated OER
Quartiles, Percentiles, and Cumulative Frequency
In this statistics lesson, 11th graders are asked to calculate the percentiles, quartiles and cumulative frequency given different graphs and data. There are 6 questions with an answer key.
Curated OER
Quartiles and Box-and-Whisker Plots
In this algebra worksheet, students identify the central tendencies as they solve a box and whisker plot graph. They identify the quartiles of the data. There are 4 questions with an answer key.


