Hi, what do you want to do?
TeachEngineering
Teach Engineering: Walk the Line: A Module on Linear Functions
This module leads students through the process of graphing data and finding a line of best fit while exploring the characteristics of linear equations in algebraic and graphic formats. Then, these topics are connected to real-world...
TeachEngineering
Teach Engineering: Latex Tubing and Hybrid Vehicles
This unit gives students the opportunity to make use of linear models in order to make predictions based on real-world data. Students experience how engineers address incredible and important design challenges through the use of linear...
ClassFlow
Class Flow: Fitting Models to Data
[Free Registration/Login Required] A basic premise of science is that much of the physical world can be described mathematically and many physical phenomena are predictable. This scientific outlook took place in Europe during the late...
Physics Aviary
Physics Aviary: Quick Graph 3.0
This program was designed as a quick graphing program that students could use on a computer, tablet or smart phone when a more complex graphing program is not available. This program will let students plot up to 10 data points and then...
TeachEngineering
Teach Engineering: Forces and Graphing
This activity can be used to explore forces acting on an object, to practice graphing experimental data, and/or to introduce the algebra concepts of slope and intercept of a line. A wooden 2x4 beam is set on top of two scales. Students...
Google
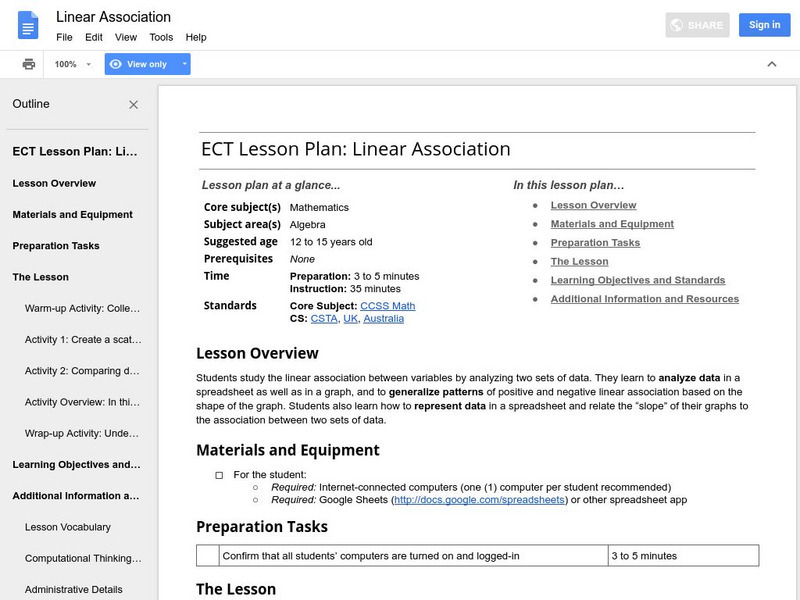
Google for Education: Linear Association
This student activity allows for practice in graphing data in a spreadsheet and relate the "slope" of their graphs to the association between two sets of data.
TeachEngineering
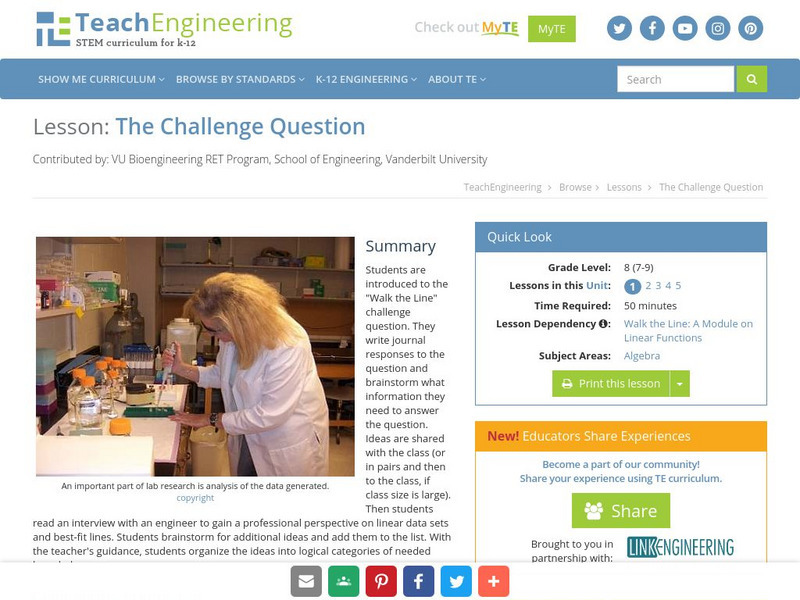
Teach Engineering: The Challenge Question: "Walk the Line"
Students are introduced to the "Walk the Line" challenge question. They are asked to write journal responses to the question and brainstorm what information they need to answer the question. Ideas are shared with the class (or in pairs...
Texas Instruments
Texas Instruments: Solving a System of Linear Equations
In this activity, students' will collect and analyze motion data in order to determine the solution to a linear system of equations. They graph two motions on a common axis and find their intersection.
Physics Aviary
Physics Aviary: Graphing Motion Lab
This lab was designed to generate some data that students can use when learning about simple graphing motion. Students will track the motion of a row boat as it moves through a course and then they will create a graph of the data that...
Texas Instruments
Texas Instruments: Exploring Linear Equations
This activity uses the Transformation Graphing Application to explore the linear equation after entering data into lists and doing a statistical plot of the data.
Texas Instruments
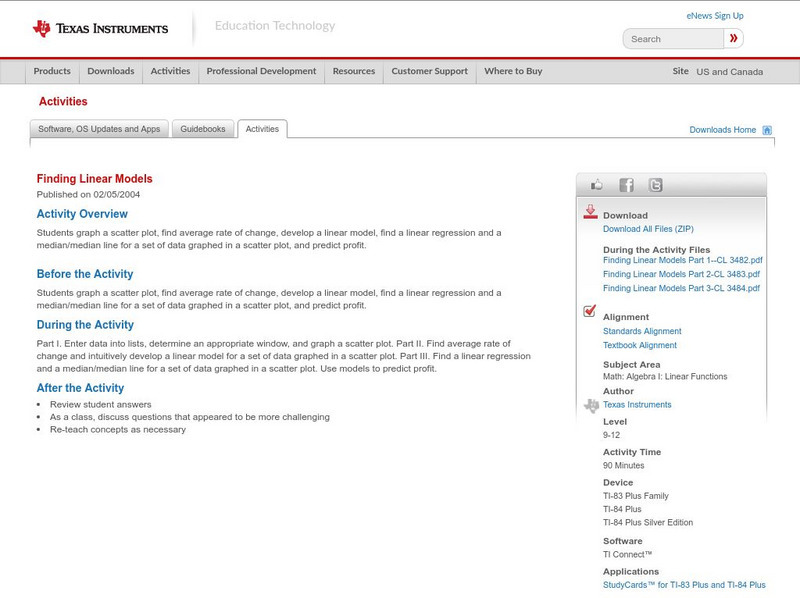
Texas Instruments: Finding Linear Models
Students graph a scatter plot, find average rate of change, develop a linear model, find a linear regression and a median/median line for a set of data graphed in a scatter plot and predict profit.
Physics Aviary
Physics Aviary: Graphing Motion Lab 2
This lab was designed to generate some data that students can use when learning about two stage graphing motion. Students will track the motion of a dragster as it accelerates and then moves at a constant speed and then they will create...
Texas Instruments
Texas Instruments: Velocity Test: Interpreting Velocity Graphs
In this activity, students' will use a motion detector to record the distance versus time data for the simple motion of a walker. They will calculate velocity from this graph and compare it with the velocity graph generated by the...
Texas Instruments
Texas Instruments: What Is a Linear Regression?
In this activity, students create lists of data points, plot them on a graph, and determine the regression equation of the best fitting line. They also understand exactly how the linear regression is determined.
Texas Instruments
Texas Instruments: Domain and Range
This StudyCard stack uses real-world contexts to teach the concepts of independent and dependent variables, and then domain and range. It includes practical examples at the end.
Other
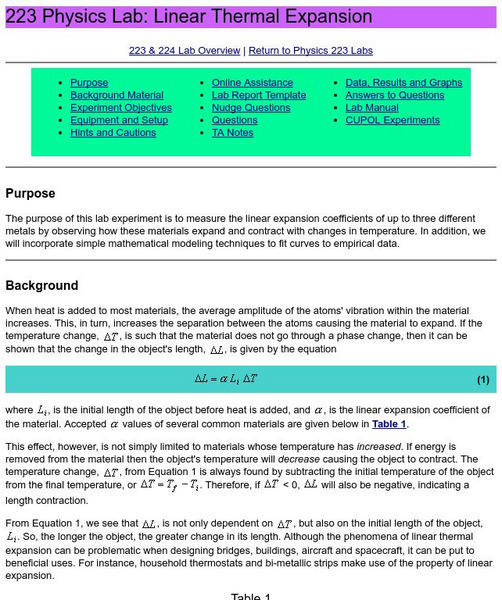
Clemson University: Linear Thermal Expansion
Clemson University offers an excellent site of linear thermal expansion lab. Includes experiment, images, charts, links, questions, and much more.
Texas Instruments
Texas Instruments: Muddy Footprints Adventure 11
In this adventure, students will analyze the relationship between height and stride length, and then use that information to identify the biker who left the footprints. They create a scatter plot, find the linear regression equation for...
PBS
Pbs Teachers: Sports and Math: Will Women Athletes Ever Catch and Surpass
Explore, explain and make conclusions based on graphs of scatter plots of the Olympic records for men and women in the same event over the same years. Plot x- and y-values, and create linear equations from the data.
Texas Instruments
Texas Instruments: A Day at the Beach Adventure 9
Students compare the heating rates of wet sand and dry sand and study the effect of evaporation on heating rates. They create, interpret and analyze graphs of data. They also relate slope to rate of change.
Texas Instruments
Texas Instruments: Ball Toss Activity
Students receive data from tossing a ball into the air. They are to graph it, set a window, and analyze the height, how long it was in the air, etc. They then find an equation that models the data.
Texas Instruments
Texas Instruments: Graph It in Pieces: Piecewise Defined Functions
In this activity, students' will record motion data for a walker and describe segments of the walker's motion using linear function. They will model the motion data using a piece-wise continuous function assembled from linear functions.
Texas Instruments
Texas Instruments: Linear Functions: Slope as Rate of Change
Students learn to associate the slope of a straight line with a constant rate of change. They also learn to calculate the rate of change from data points on a line, using the correct units. Students also learn to read from a linear...
Alabama Learning Exchange
Alex: Relationship Between Height and Length
In this lesson, eighth grade students will collect data. They will use this data to analyze the relationship between the height of an individual and the length of his/her foot. Students will use a line of fit to make predictions for...
Richland Community College
Richland Community College: Math 116 Lecture Notes
This site from the Richland Community College provides the detailed lecture notes to a college algebra course, complete with equations and definitions. Content ranges from "functions and their graphs" to "conics and parametric equations."


