Curated OER
M&M's Candies Worksheet Graph
In this graphing worksheet pupils will record data on a bar graph. Students will take a bag of M&M's and chart the colors they find inside this bag.
Curated OER
Vertical Bar Graph
In this math worksheet, students create a vertical bar graph. Students choose 5 items to compare and record data up to 20 units.
Curated OER
St. Patrick's Day Lucky Charms Sort Bar Graph
In this elementary data collection and graphing learning exercise, students paste the correct cereal pieces to match the words at the bottom of the bar graph. They count the items and fill in the graph in this St. Patrick's Day themed...
Curated OER
Favorite Animal Survey --Animals of Australia
In this favorite animal survey learning exercise, students use tally marks to survey and record data about favorite Australian animals. Students then use the results to make a graph.
Curated OER
Experiments with Levers
Students investigate levers. In this simple machine lesson, students study levers and the mechanical advantage of using levers. They will collect data and illustrate their systems for eight different tests.
Curated OER
It Counts
Learners explore how numbers can identify objects. In this math lesson, students determine how numbers are used to describe objects used in quantitative data collection.
Curated OER
Grade 2 Air Show
Students make paper airplanes and test and retest the distance they can fly. In this paper airplanes lesson plan, students make the planes, make modifications if they need to, test them, record data, and present it to their class.
Curated OER
Potential Energy: How is It Related to Kinetic Energy?
Students explore kinetic and potential energy. For this energy lesson, students launch toys cars from ramps in order to examine the relationship between potential energy and kinetic energy. Students collect data and graph the results.
Curated OER
Plastic Parade: Recycling
In this recycling worksheet, students use ten plastic containers, collect data on the recycle number on each one, and conclude if most plastics are or are not recyclable in their town.
Curated OER
Student-Led Parent Conference
Students prepare for student-led parent conferences. In this communication instructional activity, students collect data to build portfolios for use during parent conferences. Students practice their presentations in preparation for the...
Curated OER
Aluminum Boats
Students study buoyancy with an in-class experiment. In this water properties lesson, students create a boat from aluminum foil and float it in a bucket of water. Students utilize coins to change the weight of the boat and record data...
Curated OER
Watt Power
Students discuss the concept of power and the meaning of watts. In this experimental activity students divide into groups, record data and calculate the results.
Curated OER
Candy Experiment
Students investigate why a slope is negative. For this algebra lesson, students differentiate between negative and positive slopes by graphing. They collect data, write an equation and graph using the slope.
Curated OER
Can we Predict Differences?
Students differentiate between linear and non-linear graphs. In this algebra lesson, students investigate slopes as it relates to a function using graphs of linear and non-linear equations. They collect data using the TI to graph their...
Curated OER
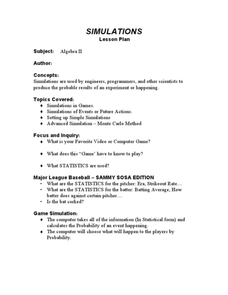
Simulation and Statistics
Students perform simulation of video games as they explore statistics. In this algebra lesson, students relate concepts of statistics and data collection to solve problems. They decide their next step based on the previous assessment of...
Curated OER
Don’t Sit Under the Apple Tree…You Might Become Famous
Students explore Newton's laws using CEENBoTs. In this physics lesson, students collect data and create tables and graphs. They calculate speed, acceleration and forces using mathematical formulas.
Curated OER
Correlation
Learners investigate correlation coefficients. In this correlation coefficient lesson plan, students explore correlation coefficient calculations. Learners research independently by collecting data, calculating the correlation...
Curated OER
Math Morphing Proximate and Evolutionary Mechanisms
High schoolers identify the different types of fractals. In this geometry lesson plan, students use math to analyze different biological phenomena. They collect data from the experiments and construct graphs.
Curated OER
What Is Technology, and How Does It Benefit Us?
Students examine and define what technology is as well as the differences between science and technology. They assess the role of science and technology in society, conveniences technology offers and create a chart to compare the...
Curated OER
Comparing Linear and Exponential Data
Students graph linear and exponential equations. For this algebra lesson, students differentiate between linear and exponential equations. They relate it to the real world.
Curated OER
Data Analysis Worksheet
In this probability activity, 11th graders solve problems using simple random sample, cluster sample, bias, population and systematic sample. They match the questions to its definition.
Curated OER
How Long...?
Students explore measurement. They use appropriate units of measurement for different sized objects. Students collect their data and enter it into an Excel data base. They graph their findings and analyze their outcomes.
Curated OER
Integers in the Weather
Middle schoolers engage in a clever lesson that combines meteorology with mathematical thinking. They use integers in relation to high and low temperatures that they record. They use a spreadsheet of weather data, a computer, and gain...
Curated OER
Weather Watchers
Students are introduced to an Underground Weather Stations. In groups, they use the internet to research the weather in different parts of the United States locating each city. To end the lesson, they summarize the information they...
Other popular searches
- Collecting and Recording Data
- Data Collection Techniques
- Math Lessons Data Collection
- Data Collection Activity
- Data Collection and Median
- Data Collection and Graphs
- Data Collection Projects
- Data Collection and Analysis
- Accurate Data Collection
- Data Collection Lesson Plans
- Experimental Data Collection
- Collection of Data


