Curated OER
Let's Gather Around the Circle
Scholars explore the relationship between circumference and diameter. Groups of learners measure the diameter and circumference of round objects and record their data on a given worksheet. They then input the data into their graphing...
Intel
What Does This Graph Tell You?
What can math say about natural phenomena? The fifth STEM lesson in this project-based learning series asks collaborative groups to choose a phenomenon of interest and design an experiment to simulate the phenomenon. After collecting...
University of Colorado
The Jovian System: A Scale Model
Jupiter has 67 moons! As the seventh in a series of 22, the exercise shows learners the size and scale of Jupiter and its Galilean moons through a model. They then arrange the model to show how probes orbited and gathered data.
Channel Islands Film
Arlington Springs Man: Lesson Plan 2
West of the West's documentary Arlington Springs Man and a two-page scientific article about the same topic provide the text for a reading comprehension exercise that asks individuals to craft a one page summary of information gathered...
Chymist
Ink Analysis: An Experiment in Paper Chromatography
Test differences in writing instruments with this hands-on activity to demonstrate paper chromatography in action. The class performs an experiment on multiple writing instruments and determines the area of separation to discover an...
Committee for Children
Students Learn to Stop Rumors Before They Start
Two activities look at how rumors are spread and ways class members can stop them. The first activity brings forth an in-depth conversation about how reporters gather information to write articles and how students can implement the same...
Curated OER
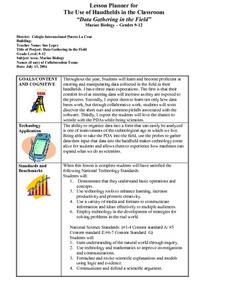
??Data Gathering in the Field??
Students demonstrate that they understand basic operations and concpets, students further use technology to enhance learning, increase productivity and and promote their creativity. Students gain an understanding of the world through...
Curated OER
Weather Predictions
Students record weather data and create a five day forecast. Students investigate the roles of meteorologists and identify symbols used on a weather map. After gathering weather data for a week, students will create a five day forecast...
Curated OER
Changing Planet: Permafrost Gas Leak
Pair earth scientists up to use an amazing online arctic portal mapping tool and Google Earth to analyze permafrost changes. They compare changes to data on atmospheric concentrations of methane to see if there is a correlation. Then...
Curated OER
Mystery Liquids: Linear Function
High schoolers determine the linear equations of the density of water and oil by collecting data on the mass of various volumes of each liquid. They construct scatter plots from the data and use these to write the linear equations for...
Curated OER
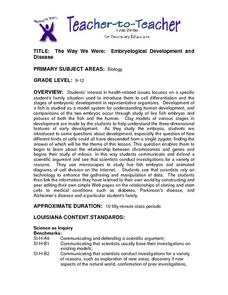
The Way We Were: Embryological Development and Disease
Students use microscopes to study live fish embryos and animated diagrams of cell division on the Internet. They see that scientists rely on technology to enhance the gathering and manipulation of data. They create web pages on cloning.
Curated OER
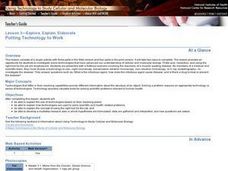
Technology-Lesson 3-Putting Technology to Work
Students explain the use of different technologies based on their resolving power. Explain how technologies are used to solve scientific and health-related problems. Explain the concept of using right tool for the job and develop a multi...
Virginia Department of Education
Prokaryotes
Lead your biology class on a cell-sized adventure! Emerging scientists construct models of prokaryotes, then design an experiment to properly grow a bacterial culture. They conclude the activity by viewing the culture under a microscope....
Curated OER
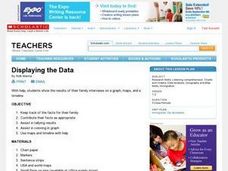
Displaying the Data
Students gather facts about their parent's families through the completion of parent interview forms. Using tally marks, the data gathered is counted, transferred to graphs and used to create family timelines.
Curated OER
Effects of Temperature, Deviation on Climate
Students collect and record data for a given city. They calculate standard deviation of temperature and analyze the impact of climate changes on a city's and culture.
Curated OER
Chart This!
Students collect and analyze data. In this middle school mathematics lesson, students collect data on three to four traits or favorites. Students analyze their data and create a chart of graph for each trait or favorite they...
University of Colorado
Spacecraft Speed
Space shuttles traveled around Earth at a speed of 17,500 miles per hour, way faster than trains, planes, or automobiles travel! In the 13th installment of 22, groups graph different speeds to show how quickly spacecraft move through...
Curated OER
Ketchup to Collecting Data
First graders collect data for a survey of 3 brands of ketchup and create class charts. They taste test three different brands of ketchup, and use the data to create a presentation. Tasty lesson!
Curated OER
Pet Shop Decision
Students are given the "Pet Store Decisions" task sheet and a rubric that goes with it. Students discuss the task and make a plan for using the rubric sheet to complete the task. Students formulate questions, studies and data collection...
Curated OER
Velocity
Students explore the concepts of velocity, acceleration, distance and football. They collect data on the velocity of a football and they determine the distance and height of a football when it is thrown. Students compare their findings...
Curated OER
Machine Technology
Students work in pairs to manufacture a product for a potential customer. They interview potential customers and collect data. Students develop a customer interview profile. They manufacture drill drift part to customer's specifications...
Curated OER
Pollution and Environmental Studies- Daily Water Use
In this environmental studies worksheet, students create a data table to discover how much water each person uses on a daily basis and what it is used for. They complete a post activity to make and test solutions for pollution using a...
Curated OER
The New York City Draft Riots: A Role Play
This is a fun, thought-provoking instructional activity. Learners use census data from 1855, primary source documents, their historical knowledge, and information regarding the New York City Draft Riots of 1863 to construct and engage in...
Curated OER
Great Lakes Homepage for Kids
Here are some outstanding lessons on the geology and history of the Great Lakes. These lessons are divided into Grade 4 -6, and Grade 7 - 8 activities. The activities all use the background information, maps, graphs, data, and Great...
Other popular searches
- Science Data Gathering
- Gathering and Graphing Data
- Data Gathering Strategies
- Gathering Qualitative Data
- Data Gathering Tests
- Gathering and Charting Data
- Math Data Gathering
- Math, Data Gathering
- Gathering Weather Data
- Data Gathering and Analysis
- Errors in Data Gathering
- Data Gathering Accuracy


