Curated OER
This is the Way We Go To School
Second graders create and utilize a graph using the Excel computer program. They gather data regarding how the students get to school, tally the numbers for the class, and create a bar graph on paper and using Excel.
Curated OER
Social Change
Students study a social issue involving gorillas, and work in groups to develop strategies to increase awareness of and problem solve a solution for the issue. They collect data using handheld computers and write a report.
College Board
2001 AP® Statistics Free-Response Questions
Develop a complete understanding of the course. Pupils and teachers use the six free-response questions to gather information about aspects of the AP® Statistics course. The resource and test section show how items cover the content. A...
Curated OER
Building Data
Pupils collect census data to help them determine where to build a new supply superstore.
National Museum of Nuclear Science & History
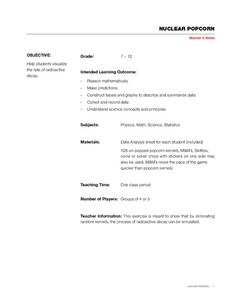
Nuclear Popcorn
Make your lesson on radioactive decay pop with this lab exercise. Using popcorn kernels spread over a tabletop, participants pick up all of those that point toward the back of the room, that is, those that represent decayed atoms. As the...
Curated OER
Cemetery Restoration Project
Who is buried in this tomb? Trek to a local cemetery, take pictures of markers, explore records, and conduct interviews to bring to life the stories behind the stones. Use Olympus and Tool Factory to coordinate and gather information...
Curated OER
Data Gathering: Vietnam
Students study the Vietnam Era by interviewing people and writing a questionnaire to gather data on the attitudes, feeling, and experiences of the interviewee during this era.
College Board
2009 AP® Computer Science A Free-Response Questions
Coding and decoding is part of the work. Pupils and teachers use the released questions from 2009 to gather information on how topics show up on the AP Computer Science exam. The four questions range from the array data structure to...
Chicago Botanic Garden
Historical Climate Cycles
Ice core samples give scientists access to climates of old—those from more than 800,000 years ago. Through an analysis of various temperature graphs from ice cores, tree rings, and weather stations, scholars compare historical climates...
Virginia Department of Education
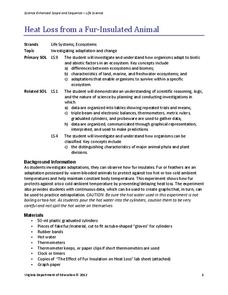
Heat Loss from a Fur-Insulated Animal
How do animals adapt to weather changes? Provide your class with the ability to understand adaptations and body temperature as they participate in this hands on experiment, using fake fur and hot water. Pupils collect data and...
Advocates for Human Rights
The Right to a Clean Environment: Water
First, young citizens learn about water consumption by doing some research themselves on their home water usage and sharing their findings with the class. Then, they do some brainstorming and devise a plan to reduce water consumption.
Curated OER
Data From Interviews
Students create and conduct a survey about favorite foods, gather and represent the data, interpret data and make predictions to present to the class. They create and use interview questions to gather data. Pupils are explained that...
Curated OER
Dear George Using Census Data
Sixth graders discuss differences in the way in which information was disseminated in George Washington's time and how it is acquired in contemporary times. They examine Census of Agriculture data and a modern day version of a letter...
Curated OER
Backyard Birds: Who's Who Out There?
Students practice techniques of field observation and data-gathering while studying local bird population, describe ecosystem as complex combination of elements, which can affect or be affected by each other, and determine effects of...
Curated OER
SUNSPOTS SPOTTED
Students study sunspots and their motion, from data gathered, they determine the significance of the sunspot data. The data be used to calculate the rotational period of the sun. They draw conclusions as to the sunspot's impact on the...
Curated OER
Community Research and Action Plan: Economic and Social Rights
Students research human rights problems in their community. They analyze and report on data gathered, and develop an action plan to address problems related to social and economic rights.
Curated OER
Calculation the Cricumference of Earth using "Google Earth"
Eighth graders investigate properties of circles. In this eight grade mathematics lesson, 8th graders apply proportional reasoning to data gathered with “Google Earth” to calculate equatorial and polar circumference of the...
Curated OER
Brays Bayou Spiderwort Genetic Study
Students formulate hypothesis based upon data gathered by examining possible crosses of spiderworts using Punnett squares. They present explanations for physiological adaptations of spiderworts that resulted from interactions within the...
Curated OER
Ketchup to Collecting Data
First graders collect data for a survey of 3 brands of ketchup and create class charts. They taste test three different brands of ketchup, and use the data to create a presentation. Tasty lesson!
US Environmental Protection Agency
Tree Rings: Living Records of Climate
Open with a discussion on weather and climate and then explain how tree rings can provide scientists with information about the earth's past climate. Pupils analyze graphics of simulated tree rings from various US locations for the...
Curated OER
Pen Pals
Learners collect bird count data at their sites, and share and compare the data collected from two different schoolyards using computer technology.
Curated OER
Nutrition and Food Security
Examine the three basic nutrients and their effects on the body. Fifth graders will research data to construct a bar graph and then demonstrate the relationship between malnutrition and food security. This is a very comprehensive...
Serendip
How Do We Sense the Flavors of Food?
We taste with our taste buds, so why do flavors change when we have a stuffy nose? Scholars experiment with taste testing while holding their noses and then while smelling. They record their observations in pairs and come together to...
University of Colorado
The Moons of Jupiter
Middle schoolers analyze given data on density and diameter of objects in space by graphing the data and then discussing their findings. This ninth installment of a 22-part series emphasizes the Galilean moons as compared to other...
Other popular searches
- Data Gathering
- Science Data Gathering
- Data Gathering Strategies
- Gather and Organizing Data
- Gather and Organize Data
- Gathering Qualitative Data
- Data Gathering Tests
- Gathering and Charting Data
- Math Data Gathering
- Math, Data Gathering
- Gather Solar System Data
- Gathering Weather Data


