Curated OER
Scientific Method
In this Scientific Method activity, students demonstrate understanding of the Scientific Method by completing a chart. Students label the important steps taken while using this method in conducting an experiment.
Curated OER
Weather Predictions
Students play the role of weather personalities by making five day forecasts based on data gathered from observations, weather instruments, and weather maps. Each day a small group makes a class forecast for the next day and reviews the...
Curated OER
Plastic Pollution
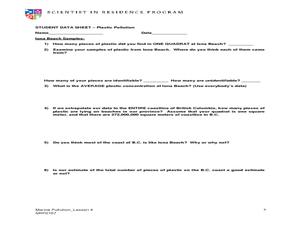
Young scholars determine with math concepts how much plastic pollution is affecting marine life. In this plastic pollution lesson plan, students collect scientific data from a field trip to a water treatment plant.
Curated OER
Measurement: Stream Flow & Stadium Capacity
Eighth graders study the scientific fields and how information can be monitored and recorded. In this scientific inquiry lesson students view a PowerPoint presentation and complete a hands on activity.
Alabama Learning Exchange
Wet Heads
Middle schoolers apply the steps of the scientific method to an experiment. They complete an instructional activity of scientific inquiry and use a spreadsheet software to create a graph illustrating data gathered.
Curated OER
Science is Alive
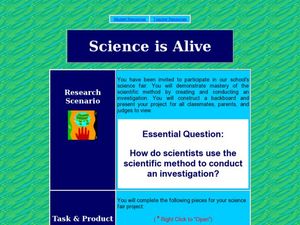
Students explore the scientific method. In this science lesson, students create and conduct a science investigation for the science fair.
Curated OER
Discover Science
Students practice scientific research skills. In this instructional activity about science, students gain experience with the following skills: comparison, observation, identification, and data gathering. Students will go from station to...
Curated OER
Nutrition and Food Security
Examine the three basic nutrients and their effects on the body. Fifth graders will research data to construct a bar graph and then demonstrate the relationship between malnutrition and food security. This is a very comprehensive...
Curated OER
Environment and the Earth
Students were involved in environmental service learning and they gathered information from academic buildings for a database. The data allowed them to use an establish baseline data on light use, recycling, and water fixtures in five...
Curated OER
Tornado!
Young scholars examine the characteristics and types of tornadoes. They discuss how they are formed, conduct an experiment with two liter bottles, analyze data and determine mean and median, and design a house to withstand tornado-force...
Curated OER
Owl Pellets
Sixth graders investigate the role of owls in their ecosystem. In this food chain lesson, 6th graders illustrate an owl food chain, dissect an owl pellet, and analyze data. Students discuss what would happen to owls if there were an...
Curated OER
You Light Up My Life
Students examine the relationship between solar activity and the Earth's geomagnetic field in producing the phenomena known as aurora borealis (Northern Lights) by reading and discussing "Earth, Wind and Fireworks." students graph data...
Curated OER
"Intelligent Design" and Ohio's Science Curriculum
High schoolers explore the debate between intelligent design and Darwinism. They research both topics by accessing primary sources. Students interview school administrators to determine what its science curriculum is and the timeline for...
Curated OER
Science: Fossil of a Carbonized Plant
Students classify leaves by shape and margins and use them to create models of plant fossils. By using paper over a leaf, they simulate fossilization of organisms onto sedimentary rocks. Following instructions on worksheets, students...
Curated OER
Graphing Inertia: An Oxymoron?
Eighth graders investigate Newton's Law of Inertia in order to create a context for the review of the use of different types of graphs. They practice gathering the data from an experiment and put it into the correct corresponding graph.
University of Colorado
Happy Landings: A Splash or a Splat?
Huygens spacecraft landed on Saturn's moon Titan in 2005, making it the farthest landing from Earth ever made by a spacecraft. In this hands-on activity, the 12th installment of 22, groups explore how density affects speed. To do this,...
Teach Engineering
Searching for Bigfoot and Others Like Him
Individuals create a GIS data layer in Google Earth that displays information about where one might find seven different cryptids. The class members research to find data on cryptid sightings they can include in their data...
Curated OER
Bruchid Investigations: Bruchid Development Investigations
While this lesson is based on the Bruchid beetle, the focus is on conducting a scientific investigation. Ecology explorers vary the temperature or the type of leaf that Bruchid eggs are laid on and test for effects on the development...
University of Wisconsin
Noting Notable Features for Rain Gardens
Eight groups in your class are each responsible for a different aspect of surveying the campus for a suitable rain garden location. Features to consider include water flow, topography, sun/shade patterns, land surface, vegetation,...
Kenan Fellows
Using Water Chemistry as an Indicator of Stream Health
Will this water source support life? Small groups test the chemistry of the water drawn from two different sources. They then compare the collected data to acceptable levels to draw conclusions about the health of the source. The...
Curated OER
Speed Challenge
In this science activity, students create a race track and mark each distance as stated. Then they perform each task and record the time it takes them for each. Students also record their data from the experiment into the chart...
Messenger Education
Look But Don’t Touch—Exploration with Remote Sensing
Mars is home to the tallest mountain in our solar system, Olympus Mons. In this set of two activities, learners review geologic land formations through the analysis of aerial maps. They then apply this knowledge to aerial maps of objects...
Curated OER
Weather
Learners participate in a variety of mini-lessons including experiments, literature readings, physical education components, music, data gathering and recording and more to expose them to several themes of weather; i.e. water cycle,...
Curated OER
Weather with Lewis and Clark
Students track the weather and temperature for the same time period that Lewis and Clark were at Fort Mandan. The students compile data and use it for comparisons.


