Curated OER
Blue Crabs - The Blue Crab's Chesapeake Journey
A plethora of information about the blue crabs of Chesapeake Bay will amaze and delight your marine biologists. They learn, through direct instruction, about the characteristics and life cycle of this fascinating arthropod. A highlight...
Curated OER
A Comparison Study of Water Vapor Data to Precipitation over North America
Students use NASA satellite data to compare water vapor over the United States. In this data analysis instructional activity students use an Excel spreadsheet to map their data.
BioEd Online
Good Stress for Your Body
Stress the importance of the different types of pressure our mind and body experience in a lesson about how certain types of stress are actually necessary and good for our bodies. As astronauts and people with injuries can attest, not...
Curated OER
Fire Wars
Your class can practice collecting and analyzing data. They extrapolate information and derive data from fire season statistics. They also choose the most appropriate format to display collected data.
National Wildlife Federation
Quantifying Land Changes Over Time Using Landsat
"Humans have become a geologic agent comparable to erosion and [volcanic] eruptions ..." Paul J. Crutzen, a Nobel Prize-winning atmospheric chemist. Using Landsat imagery, scholars create a grid showing land use type, such as urban,...
Nuffield Foundation
Monitoring the Body's Reaction to Stress
When stressed, do you prefer the fight or flight response? Scholars observe, measure, and identify the body's response to stress using a well-researched methodology. They learn about the autonomic nervous system, hormones, and more.
Curated OER
A world of oil
High schoolers practice in analyzing spatial data in maps and graphic presentations while studying the distribution of fossil fuel resources. They study, analyze, and map the distribution of fossil fuels on blank maps. Students discuss...
Curated OER
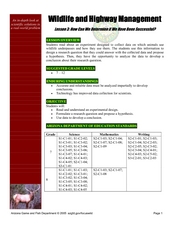
Wildlife and Highway Management
Students create a research questions about animal underpasses and how animals use them. In this animals lesson plan, students use their collected data to answer their question.
Curated OER
Energy Efficient Homes
Young scholars observe and gather data from a model simulated home. In this efficiency lesson students examine the factors that influence energy efficiency, complete a lab activity then draw conclusions from their data.
Curated OER
Management of Wildlife Resources
Learners investigate how wildlife management policies affect the size of large animal populations. They develop a spreadsheet that incorporates a mathematical model to predict big game herd sizes, and using worksheet data manage a bison...
University of Minnesota
Makes Me Sweat
Never let them see you sweat ... unless you can't help it! Scholars design an experiment to determine the effects of stress on the body. They monitor sweat production under different conditions and relate the response to the function of...
Curated OER
Using SWMP Data
Pupils are introduced to the SWMP system which tracks short-and long-term changes in water. Using this data, they plot and interpret the data on a graph to determine how human activities are lowering the water quality. They also identify...
NASA
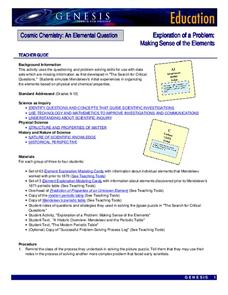
Exploration of a Problem: Making Sense of the Elements
When given too much data to simply memorize, it helps to sort it into manageable groups. The second lesson in the six-part series of Cosmic Chemistry challenges groups of pupils to take a large amount of data and figure out how to best...
Nuffield Foundation
Assessing Skin Sensitivity—Touch Discrimination
How do we distinguish between the number of things touching our skin? Scholars explore an interesting lesson plan through an experiment. They learn that there must be an unstimulated sensory unit between two touches to distinguish them....
Curated OER
National Marine Sanctuaries Fish
Information is provided on Gray's Reef, Florida Keys, and Flower Garden Banks marine sanctuaries. Young marine biologists then visit the FishBase and REEF databases to collect fish species information for each location. They then...
Curated OER
Ghostbusting in the Chesapeake
Ghost pots, fishing gear lost during crabbing expeditions, continue to trap crabs that are never collected. Increase your budding ecologists' awareness of human impact on the environment as well as conservation efforts using this...
Curated OER
Creating Biodiesel and Mitigating Waste
Biotechnology pros produce their own biofuel using waste oil and fresh vegetable oil. They test the quality of their product using titration techniques and pH analysis. They write their observations and report their findings. Be aware...
Curated OER
Integrated Unit on Nevada Solid Waste Disposal
Sixth graders examine how to gather and interpret data, accept responsibility for the environment, and demonstrate an interest in making a difference in this series of lessons.
Curated OER
The Effect of Acid Rain on Limestone
Pupils investigate the pH of rain water in this earth science lesson. They collect rain water from their area and explore the pH when lime stone is added, then they will use the data collected to conjecture as to the effect of acid rain...
Curated OER
Chemical Resistance and Synthetic Polymers
Students participate in lab activities in which they examine immersion, stain resistance, and stress cracking of synthetic polymers. Students use their collected data to discuss service applications and possible performance of materials.
Baylor College
HIV/AIDS in the United States
In the final of five lessons about HIV/AIDS, groups create presentations to share data about the infection rates in the United States, examining demographic and geographic trends over the past ten years. Depending on how much time you...
Curated OER
Are There Too Many Elk?
Young scholars study elk populations in Arizona. For this data lesson students read an article on monitoring elk populations, analyze data and make management recommendations.
Curated OER
Power Metering Project
Young scholars collect and analyze variable data and understand the concept of electrical power. In this energy lesson plan students use a spreadsheet to manage their data and create box plots.
Curated OER
Tables, Charts and Graphs
Students examine a science journal to develop an understanding of graphs in science. In this data analysis lesson plan, students read an article from the Natural Inquirer and discuss the meaning of the included graph....
Other popular searches
- Measurement Data Management
- Data Management Story
- Math and Data Management
- Math Lesson Data Management
- Data Management and Graphing
- Data Management Computing
- Data Management Analysis
- Data Management Math
- Data Management Lesson Plan
- Data Management Math Lessons
- Data Base Management Systems
- Business Data Management


