Curated OER
Virtual Field Trip
Are we there yet? Young trip planners learn about their state and plan a trip. They will select sites to see in three cities in their state, and record associated costs in a spreadsheet. While this was originally designed as a...
Curated OER
Time Management
Students plot activities for a 24 hour day. They record their information on a spread sheet program. Students list categories they use and write equations for cells that add cells of each category together. Students create a pie chart of...
Curated OER
Collecting My School Family Data
Pupils are tasked with collecting data on their school. In groups, they collect data on various aspects of school life along with social and economic backgrounds and charactertics of their hair and eye color. They draw two pictures,...
Curated OER
Earthquake on the Playground
Students investigate earthquakes by examining chart data. In this disasters lesson, students identify the waves that are recorded when an earthquake arises by reading sample graphs in class. Students participate in an earthquake...
Curated OER
Local Traffic Survey
Students conduct a traffic survey and interpret their data and use graphs and charts to display their results.
Curated OER
The Human Line Plot
Fifth graders collect data and use charts and line plots to graph data. Through class surveys, 5th graders collect data concerning a particular subject. They graph their data using a line graph. Students make inferences and predictions...
Curated OER
Bias in Statistics
Students work to develop surveys and collect data. They display the data using circle graphs, histograms, box and whisker plots, and scatter plots. Students use multimedia tools to develop a visual presentation to display their data.
Curated OER
Math: Football Fever Fun
Students compile statistics from high school or other football team and construct a spreadsheet on which to record their findings. Using Chart Wizard to analyze the data, they construct charts and graphs for a visual display of the...
Curated OER
Graphing Data Brings Understanding
Students collect, graph and analyze data. In this statistics lesson, students use circle, pie, bar and lines to represent data. They analyze the data and make predictions bases on the scatter plots created.
Curated OER
Collecting Data
In this data collection instructional activity, learners read about how data is collected and organized. They also learn about a hypothesis. Students read through examples of different charts and then answer 23 questions pertaining to...
Curated OER
What's Your Favorite Season?
Students collect data on the favorite seasons. In this data collection and analysis lesson, students learn about displaying data on charts and graphs. They collect data about the favorite seasons of the children in their class and...
Curated OER
Weather Instrument Data Chart 2
In this science worksheet, students look for the data that is needed to fill in the graphic organizer. The prefixes are given that are needed to sort the information as it is collected.
Curated OER
M&M Graphing
Fourth graders name colors of M&Ms and record answers. They estimate number of M&Ms of each color found in a typical package of M&Ms on piece of paper.They record information on sheet of paper and create a spreadsheet. paper.
Curated OER
Data Analysis and Probability Race to the Finish
Students practice addition facts, record data, and construct a bar graph. In this probability lesson, students participate in a board game in which bicycles move towards a finish line based on players completing addition problems. Dice...
Curated OER
Data Analysis Digital Display
Students create a survey online. In this math lesson, students graph survey data using flisti.com. They share and analyze their classmates' histogram.
Curated OER
Charting Weight
Sixth graders record the weight of themselves and 3 family over a week, and then use that data to compile 2 bar graphs and 4 line graphs and answer a series of questions.
Curated OER
Math--Pictures and Bars--Learning About Graphs
What is a graph? What does it tell us? How do you make one? These are all questions that are answered in the included packet. It's a great introduction to graphing for young learners!
Chicago Botanic Garden
Recent Weather Patterns
Decide whether weather is changing! A two-part activity first challenges classes to review the differences between weather and climate. Once finished, individuals then analyze historical data to determine if climate change is happening...
Curated OER
Counting Coins
Second graders identify a quarter, dime, penny, nickel, and dime. They match the coin with it's monetary value, collect data on excel spreadsheet, and create a graph in Excel. Students participate in group activities.
Curated OER
Arthropod Data Collection
Young scholars describe the life cycle of various bugs as well as their predators and feeding habits. The class participates in a discussion of the various methods scientists use to gather data including research and experiment. After...
Curated OER
Favorite Survey
Fourth graders collect and organize data for charts and bar graphs by questioning their classmates. They utilize a worksheet imbedded in this plan which guides them through their 'favorites' survey.
Curated OER
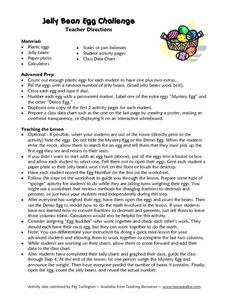
Jelly Bean Egg Challenge
Students each receive a plastic egg filled with jelly beans. In this Jelly Bean Egg Challenge, students estimate and weight their eggs, they count the number of jelly beans inside their egg, they chart their data and compare their data...
Curated OER
Favorite Food
Students are given three choices of food. They then decide on their favorite and predict what the class's favorite food will be. After the teacher enters the data into the computer, students gather around the computer to view the...


