Kenan Fellows
Man vs. Beast: Approximating Derivatives using Human and Animal Movement
What does dropping a ball look like as a graph? An engaging activity asks learners to record a video of dropping a ball and uploading the video to software for analysis. They compare the position of the ball to time and calculate the...
NOAA
Importance of Deep-Sea Ecosystems – How Diverse is That?
When judging diversity of an ecosystem, both species evenness and species richness must contribute. After a discussion of diversity and a guided example using the Shannon-Weaver function, scholars use the same function on two other...
Illustrative Mathematics
Latitude
The greater the latitude, the less of the Earth is north. Scholars graph the relationship between the latitude and the percentage of the Earth that is north of the latitude. Using the graph and the table, class members interpret values...
Curated OER
Sandia Aerial Tram
Your learners analyze a table of real-life data in order to write an equation that best models the information. Exponential, quadratic, and linear rates of changes are all possibilities in this task.
Virginia Department of Education
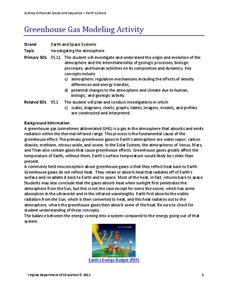
Greenhouse Gas Modeling Activity
Why are greenhouse gases called greenhouse gases? Young Earth scientists learn about greenhouse gases though experimentation in the second installment of a 3-part series. They use lamps to model radiant energy as well...
Curated OER
Conversions: Capacity
Practice converting units of measurement and reading data from a table. Young learners study a conversion table at the top of the page, and use the information about converting units of capacity (ounces, cups, quarts, etc.) to solve the...
Curated OER
Changing Planet: Melting Glaciers
Resource links to a video, satellite images, data, and photographs of glaciers provide emerging earth scientists the opportunity to examine how the ice has been retreating over the years. A data table is included for pupils to record...
Curated OER
Adaptation Investigation - Extreme Beaks
Find photos of bird beaks or show a prepared four slide PowerPoint, "Extreme Beaks" to introduce your class to this special animal adaptation. Provide them with a data table and supplies to try gathering food with tools that each...
EngageNY
Modeling a Context from a Verbal Description (part 1)
When complicated algebraic expressions are involved, it is sometimes easier to use a table or graph to model a context. The exercises in this instructional activity are designed for business applications and require complex...
Adrian College
The Universe
Young scientists create a simulation of Hubble's law. Introducing the Big Bang Theory using balloons and a simple lab learning exercise, scholars complete a data table and perform analysis.
Curated OER
Acid Rain
Simulated acid rain, a dilute sulfuric acid solution, needs to be prepared for this demonstration. After a condensed lecture on acid rain, you will apply the solution to a sample of granite and a sample of limestone. Your young...
Curated OER
Glaciers: Then and Now
A large data table is given to your elementary earth scientists in which they record observations that they make while viewing pictures of Alaskan glaciers. They compare and contrast recent photos with older photos. Hold a discussion...
Curated OER
Respiration
This series opens with diagrams of experimental setups. A data table is displayed and questions are asked, indicating that the intent is for lab groups to perform the depicted experiments. At slide twelve, a coherent lesson about the...
California Academy of Science
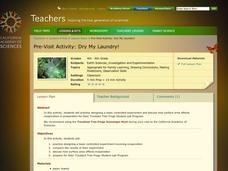
Dry My Laundry!
Meant to be a pre-field trip lesson, this can also serve as a cute and simple activity to use when your little ones are learning about evaporation or surface area. The children cut tiny t-shirts out of paper towel material, wet them, and...
Carnegie Mellon University
Renewables Workshop
Youngsters examine resource maps to find out which states are using solar and wind power and discuss as a class various other renewable energy sources. They use a provided data table to record pros and cons to each technology, build and...
Royal Society of Chemistry
Esters from Alcohols and Acids
Fats and oils often contain esters, which sometimes find their way into perfumes due to their pleasant smells. Scholars match the name of esters made from four different types of alcohol and four different types of carboxylic acids....
Royal Society of Chemistry
Shapes of Molecules—Hybrid Orbitals
Take your chemistry class' knowledge of molecular geometry to the next level! Introduce orbital hybridization with a series of related games. Individuals complete a data table in the first activity, then solve Sudoku-like puzzles using...
Curated OER
Cleaning up an oil spill
Small groups complete a science project involving cleaning up an oil spill. In this experiment, pupils use 4 different sorbents to discover which one absorbs the most oil. Afterward, they make a data table.
Curated OER
Displacement vs. Distance Worksheet
Displacement is a foundational concept for physics pupils. If they are having trouble discerning it from distance, this activity can help clear things up. The first page is essentially a piece of graph paper. It has a compass rose and a...
Curated OER
Choose an Appropriate Graph
In this graphs worksheet, students solve 6 fill in the blank problems where they choose the most appropriate type of graph for each set of data and explain why they chose that type. Students use bar graphs, histograms and circle graphs....
PhET
Radioactive Dating Game
Uranium 235 has a half-life of over 700 million years and is the fuel used in the atomic bomb dropped on Hiroshima, Japan. Pupils see the half-lives and decay rates of Carbon-14 and Uranium-238. They also take measurements of these two...
Core Knowledge Foundation
First Grade Skills Unit 5
Twenty-two lessons make up a unit that focuses on first-grade skills. Scholars examine spelling alternatives—their rules and patterns, practice tricky spelling and high-frequency words, explore plural nouns and sentences, read a...
Curated OER
Algebra- Cell Phone Plans
High schoolers analyze graphs to compare cell phone plans. In this algebra lesson, students work together to analyze phone plans and report the best phone plan. High schoolers develop tables and graphs.
Curated OER
Interpreting Oceans of Data
Sixth graders analyze the data from a scientific experiment. In this statistics lesson, 6th graders answer questions about some data to show their understanding of the data. They apply the result to future decisions when using data.
Other popular searches
- Data Tables
- Data Displays
- Displaying Data
- Create Data Table
- Data Table and Graph
- Creating Data Tables
- Science Data Tables
- Creating a Data Table
- Making Data Tables
- Organizing Data in Tables
- Solar System Data Table
- Data Tables and Graphing


