Curated OER
Compare and Contrast Culture
Fifth graders compare and contrast the cultures of American culture with that of the other cultures of North America. Using traditional and Internet research, 5th graders gather data on one element of culture for comparison. Data...
Curated OER
Analysis of Grooming Behavior in Drosophila melanogaster
Students engage in a lab that focuses on animal behavior in an open ended inquiry based laboratory experience. They build an ethogram, display a transition matrix and analyze a Markov Chain. They remove wings from the drosophila and...
Howard County Schools
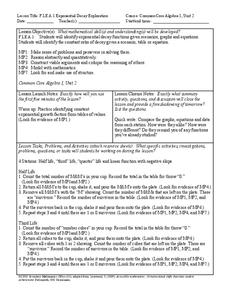
Exponential Decay Exploration
How can you model exponential decay? Explore different situations involving exponential decay functions and decreasing linear functions by performing activities with MandM candy, popcorn kernels, and number cubes.
Curated OER
Introduction to Graphical Representation of Data Sets in Connection to Cellular Growth
Learners practice graphing relationships between variables by studying topics such as exponential growth and decay. They conduct a series of numerical experiments using a computer model and a variety of physical experiments using mold,...
NASA
Christa's Lost Lesson: Effervescence
How are chemical reactions affected by gravity? Learners explore the phenomenon of effervescence as part of the Christa's Lost Lessons series. They compare findings in an experiment on effervescence to a video of a similar experiment in...
Chymist
Plop, Plop, Fizz, Fizz
One of the most recognizable commercial melodies was written in 1977, and led to gastronomical relief around the world. Scholars use Alka Seltzer tablets to measure reactants and calculate the chemical equation for the reaction of NaHCO3...
Curated OER
Energy Conservation
Students investigate energy conservation. In this energy conservation and analyzing data lesson, students identify and explain several energy sources and research renewable and nonrenewable energy sources. Students use statistics...
Curated OER
Elastic Recoil in Arteries and Veins
A lab in which high schoolers examine the difference between arteries and veins. Budding biologists will find out which blood vessel can stretch furthest, recording their data in a table then answering several questions evaluating their...
American Chemical Society
Curious Crystals
Crystals are more than meets the eye! Can learners tell them apart simply by observation? As they examine five samples with a magnifier, they find that appearance alone is not enough. This serves as an introduction to a mini unit on...
American Chemical Society
Comparing the Amount of Acid in Different Solutions
Upcoming chemists use chemical reactions to determine relative pH in two different acids. This is a terrific lesson for middle schoolers that can stand alone as a practice in precision and lab skills, or as part of the unit on chemical...
Curated OER
Investigate Pine Creek!
Young scholars are invited to become detectives in this Web-Integrated Science Environment (WISE) as they explore a local creek, its environment and ongoing status. Students participate in field trips, acquisition of data through water...
Curated OER
Heartbeat Project
Students enter information about their heartbeats into a spreadsheet. They construct data displays and calculate statistics. They describe and justify their conclusions from the data collected.
Curated OER
Survey Says...
Young learners create and implement a school-wide survey about student body favorites! Learners record and analyze the data on a bar graph, picture graph, and line graph, and then display the data. Then, wrap it all up with a celebration...
Curated OER
Graphing Pendulum Results
Sixth graders set up a pendulum experiment deciding which variable to manipulate (length of string or weight on the string). They create a hypothesis, collect necessary equipment, and write out each step of their experiment. They then...
Curated OER
Weather's Outer Limits
Pupils make educated guesses and explain their reasoning and compile, graph, and map weather data. They then study environmental weather extremes on earth and discover that many variables determine climate.
Curated OER
Algebra 1
Students study the functional relationships of a variety of problems. For this functional relationship lesson, students determine the dependent and independent quantities of a given set of data. Students record the data and...
Curated OER
Endangered Species
Ninth graders graph data in order to compare the number of extinct species and a rise in human population. They analyze the data collected. Students are encouraged to infer the relationship.
Curated OER
Weather Lesson
Students discuss the weather conditions. They read thermometer, rain gauge, barometer, and wind direction and speed. They record observations of weather conditions and enter information into data base on the computer.
Curated OER
How's The Weather?
Students make a box and whiskers plot using the TI-73 graphing calculator. Each student would have their own calculator but they would work in small groups of two or three to help each other enter the data and make the plots.
Curated OER
Probability: The Study of Chance
Students conduct an experiment, determine if a game is fair, and collect data. They interpret data, then display line graph. They conduct analysis of game for probability.
Curated OER
Sundials and Shadows - What Can They Teach Us About Seasons?
Students collect and analyze data relating to seasonal changes. They view a video, research web sites and build a sundial to collect their data.
Curated OER
Investigation-How Many Toothpicks?
Seventh graders use toothpicks to investigate a series of designs and identify patterns. Data is organized and analyzed using tables and graphs, and students make generalizations using algebraic expressions.
Curated OER
How Alike Are We?
Fourth graders find the range, mode, median, and mean for each of the data sets (height and shoe size). They discuss which measure of central tendency for each data set best represents the class and why. Students graph the shoe size and...
Curated OER
Fun with Math using Magnetic Force
Sixth graders explore and discuss the effectiveness of magnets in different situations. In this math instructional activity, 6th graders discuss rate and graphs after exploring with magnets using different restrictions on the magnets....
Other popular searches
- Data Tables
- Data Displays
- Displaying Data
- Create Data Table
- Data Table and Graph
- Creating Data Tables
- Science Data Tables
- Creating a Data Table
- Making Data Tables
- Organizing Data in Tables
- Solar System Data Table
- Data Tables and Graphing


