Curated OER
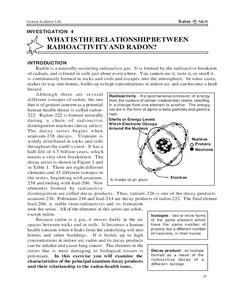
What is the Relationship Between Radioactivity and Radon?
For this radon and radioactivity worksheet, high schoolers analyze the data of the isotopes of elements that occur in the decay series of uranium-238. Students answer 6 questions about the isotopes, their half-lives, their potential...
Curated OER
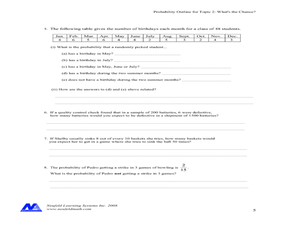
Concept: What's The Chance?
In this concept worksheet, students perform probability experiments. Using collected information, they interpret the data. Students answer questions about probability. This five-page worksheet contains approximately 15...
Curated OER
Water, Water Everywhere
Students explore water. In this water absorbency lesson plan, students experiment with different items to see if they absorb water. Students record their findings on a data sheet. Students then try making music with drinking glasses...
Curated OER
Green Food Graph
Students explore graph making by investigating St. Patrick's day food. In this holiday food lesson, students discuss their favorite green foods in honor of St. Patrick's day. Students create a graph based on the data of which green foods...
Curated OER
Its OK To Be a Clod
Middle schoolers describe factors that affect the solubility of a chemical substance in seawater. In this sea environment lesson, student explain how information on the solubility of a substance can be used to measure water currents....
California Academy of Science
Measuring Earthquakes
After a brief discussion on earthquakes, make a makeshift seismograph to record the shaking of the table that it sits upon. While the background information will be useful to you as a teacher, the seismograph does not seem like it would...
Curated OER
Interpreting and creating tables
Students observe examples and discuss how to interpret them. They then
brainstorm examples of possible questions students could use to create a table. They take time to formulate a question and collect data.
Curated OER
Shopping Around
Third graders select a recipe and compare prices for ingredients at two different stores. They select the best place to buy the ingredients and answer questions about the process. They include their data on a spreadsheet related to their...
Curated OER
Algebra: Do You See What I See?
Students discover how to find the mean, median, and mode from sets of data. By using statistical techniques such as whisker plots and bar graphs, they display the data gleaned from problems. Individually, students complete projects...
Curated OER
"In/Out Tables of Potential Crop Loss from Defoliation
For this economics worksheet, 4th graders use the data to determine the effects of crop loss due to defoliation from the effects of hail at different stages of growth.
National Security Agency
Are You Ready to Call the Guinness Book of Records?
Learners design questions that can be answered by collecting data. In this line-plot lesson, pupils collect data and graph on a line plot on world records. An abundant supply of teacher support is provided in this resource.
Curated OER
Making Money and Spreading the Flu!
Paper folding, flu spreading in a school, bacteria growth, and continuously compounded interest all provide excellent models to study exponential functions. This is a comprehensive resource that looks at many different aspects of...
Science 4 Inquiry
Edible Plate Tectonics
Many people think they can't observe plate tectonics, but thanks to GPS, we know that Australia moves at a rate of 2.7 inches per year, North America at 1 inches per year, and the Pacific plate at more than 3 inches per year! Scholars...
Oregon State
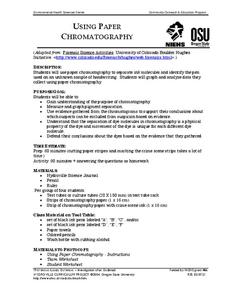
Using Paper Chromatography
Through the analysis of paper chromatography to separate ink from the pen found at the crime scene, learners analyze the different stains and through calculations determine the thief.
Curated OER
What is the Nature of Science?
Conduct a survey about the nature of science with your high schoolers. They will record their responses in a table and then discuss the implications of scientific theory. Note: There are activity sheets, and forms included with this lesson.
Curated OER
Shaquille O'Neal Hand/Foot Span
Eighth graders measure foot length and hand span in this experiment to determine the ratio. They apply the ratio to determine Shaquille O'Neal's hand span if given his shoe size.
Curated OER
Saving Energy Through Ecological Landscape Design
Learners are able to transcribe to scale the plant features of a common landscape. They determine true north and south and collect and record data on a table. Students calculate a rating for and describe a definition of insulation and...
Curated OER
Marvelous Magnets
Students identify and classify magnetic and nonmagnetic materials and metals. After determining which materials and metals are magnetic, students create a data table and classify items by two different criteria. Students e-mail various...
Curated OER
Parts Per Million
Students perform serial dilution of food coloring experiment with partner, examine concentration levels, and differentiate parts per million (PPM) and parts per billion (PPB). Students complete pre-lab and post-lab questions and data table.
Curated OER
Statistically Lyrical
Students examine and discuss the writing of ratios as fractions and where they can be found in the real world. They complete worksheets and a questionnaire, and calculate the mean, median, and mode scores for the class.
Curated OER
Bungee M&M's
Eighth graders experiment with M&M's and a cup attached to a spring to to simulate a bungee jump. They graph the results of the experiment and make predictions for continuing the experiment. They determine the "line of best fit."
Curated OER
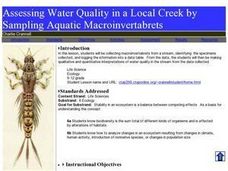
Assessing Water Quality in a Local Creek by Sampling Aquatic Macroinvertabrets
High schoolers experiment collecting macroinvertebrates from a stream and identify the specimens collected and then log in the information into a data table. From the data, they make qualitative and quantitative interpretations of water...
Curated OER
Successful Resource-based Learning Strategies for the Geography of Canada Course
Students conduct a statistical research project on population changes. They evaluate demographic issues, such as the size and location of native people. immigrant groups, and the age and gender of the population.
Curated OER
How Do Clouds Affect Radiative Energy
Students graph the upwelling and downwelling of shortwave radiation. They create a data table with the information. Students compute the Watts per square meter. They discuss their results and whether or not cloud type affects daily...
Other popular searches
- Data Tables
- Data Displays
- Displaying Data
- Create Data Table
- Data Table and Graph
- Creating Data Tables
- Science Data Tables
- Creating a Data Table
- Making Data Tables
- Organizing Data in Tables
- Solar System Data Table
- Data Tables and Graphing
