Beyond Benign
Medical Ethics
Just because we have the ability to determine an organism's traits through genetic testing, should we do it? Middle-school medical experts examine the ethical dilemmas in biotechnology in the 18th and final installment in a series of...
Curated OER
Weather, Data, Graphs and Maps
Learners collect data on the weather, graph and analyze it. For this algebra lesson, students interpret maps and are able to better plan their days based on the weather reading. They make predictions based on the type of clouds they see.
Curated OER
Quantitative Data
In this quantitative data worksheet, pupils compute measures of central tendency, draw vertical line diagrams, and compare collected data. This 23-page worksheet contains approximately 100 multi-step problems. Explanations and examples...
Virginia Department of Education
Calculating Measures of Dispersion
Double the fun — calculate two measures of deviation. The lesson plan provides information to lead the class through the process of calculating the mean absolute deviation and the standard deviation of a data set. After learning how to...
Virginia Department of Education
Line of Best Fit
Pupils work through a guided activity on fitting a linear equation to a set of data by entering the data into a calculator and trying to envision a line of best fit. They then have the calculator determine the least-squares line and...
Virginia Department of Education
May I Have Fries with That?
Not all pie graphs are about pies. The class conducts a survey on favorite fast food categories in a lesson on data representation. Pupils use the results to create a circle graph.
Virginia Department of Education
Linear Curve of Best Fit
Is foot length to forearm length a linear association? The class collects data of fellow scholars' foot length and the length of their forearms. They plot the data and find a line of best fit. Using that line, they make predictions of...
Curated OER
End-of-Year Practice Test (Grade 8 ELA/Literacy)
Common Core testing on your mind? Ease your class into the test by requiring pupils to take this practice test. The focus of this test is reading. Learners read several passages, both literary and informational, and respond to multiple...
Curated OER
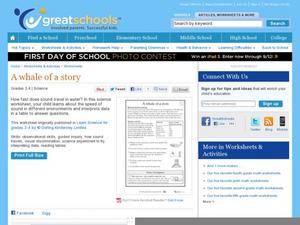
A Whale of a Story
Does sound travel faster in water or in the air? Put the question to the test with a science experiment. After reviewing a table of data, third and fourth graders decide which statements are true and which ones are false. The bottom of...
Curated OER
Making Logic Out of Madness
Tenth graders organize and interpret data from a student health program. In this physical education lesson, 10th graders use a body composition analyzer over 8 weeks to determine the validity of a student health program. Data obtained...
Curated OER
Data and Scientific Graphs
Students conduct experiments and graph their data. In this statistics instructional activity, students collect data and graph it on a coordinate plane. They analyze the data looking for patterns and they discuss their findings with the...
Curated OER
Organizing Data
For this statistics worksheet, 11th graders collect data and organize it using a frequency table. They plot their data and analyze it using stem and leaf plots. There are 3 questions with an answer key.
Cornell University
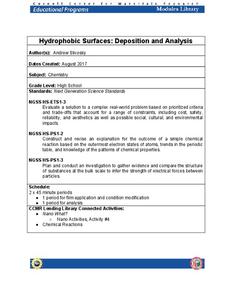
Hydrophobic Surfaces—Deposition and Analysis
Couches, carpets, and even computer keyboards now advertise they are spill-resistant, but what does that mean? Scholars use physical and chemical methods to coat surfaces with thin films to test their hydrophobic properties. Then they...
Curated OER
Data Collection
Students investigate qualitative and quantitative data. In this statistics lesson, students gather data on heights and weights of people and graph the distribution. Students discuss the differences between qualitative and quantitative data.
US Department of Agriculture
Sink or Float?
Will it sink or will it float? Learners predict the outcome as they drop random objects into a container of water. Then, they keep track of the results and record the data in a t-chart to draw a final conclusion.
Virginia Department of Education
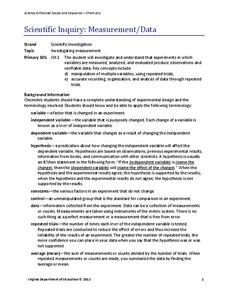
Scientific Inquiry: Measurement/Data
While pupils design their own lab experiments, they will not form a new species. Scholars take their materials and design an experiment regarding reaction rates.
Los Angeles County Office of Education
Assessment for the California Mathematics Standards Grade 1
Here is an assessment designed to test mathematicians' knowledge of writing numbers, comparing numbers, skip counting, solving addition and subtraction problems; along with measuring objects, telling time, identifying shapes, reading...
Los Angeles County Office of Education
Assessment for the California Mathematics Standards Grade 2
Test scholars mathematic skills with an assessment addressing addition, subtraction, multiplication, place value, measurement, geometric shapes, expanded notation; and their ability to compare numbers, write number sentences, draw...
Virginia Department of Education
Field Goals, Balls, and Nets
Score a resource on ratios. Young mathematicians learn about different ways to express ratios. Using sports data, they write statements about the statistics in ratio form.
Howard Hughes Medical Institute
Got Lactase? Blood Glucose Data Analysis
Many physicals include a blood glucose test, but what are doctors actually testing? Scholars graph and interpret blood glucose data, allowing them to observe the differences in lactase persistence and draw conclusions. They then connect...
Curated OER
Data Analysis
In these data analysis worksheets, students complete 4 worksheets of activities for analyzing data. Students use the mean, median, mode, and range to organize the data.
Curated OER
Pictures of Data: Post Test
In this data worksheet, learners answer multiple choice questions about charts and graphs. Students answer 10 questions total.
Curated OER
Data Analysis Self-Test
In this data analysis worksheet, students complete 1 problem that has 7 parts involving mean, median, mode, range, and quartiles. Students then perform 5 operations with matrices.
Curated OER
Pictures of Data
In this data worksheet, students look at maps and charts and answer multiple choice questions about them. Students complete 10 questions.


