EngageNY
Making Fair Decisions
Life's not fair, but decisions can be. The 17th installment of a 21-part module teaches learners about fair decisions. They use simulations to develop strategies to make fair decisions.
EngageNY
Revisiting the Graphs of the Trigonometric Functions
Use the graphs of the trigonometric functions to set the stage to inverse functions. The lesson plan reviews the graphs of the basic trigonometric functions and their transformations. Pupils use their knowledge of graphing functions to...
EngageNY
Nonlinear Models in a Data Context
How well does your garden grow? Model the growth of dahlias with nonlinear functions. In the instructional activity, scholars build on their understanding of mathematical models with nonlinear models. They look at dahlias growing in...
EngageNY
Using Linear Models in a Data Context
Practice using linear models to answer a question of interest. The 12th installment of a 16-part module combines many of the skills from previous lessons. It has scholars draw scatter plots and trend lines, develop linear models, and...
EngageNY
The Pythagorean Theorem
Class members explore the estimation of irrational numbers in association with the Pythagorean Theorem. The first lesson of this module challenges pupils to use the Pythagorean Theorem to find unknown side lengths. When the length is not...
EngageNY
Decimal Expansions of Fractions, Part 1
Is it possible to add infinitely long decimals? As pupils complete the examples in the ninth lesson of this 25-part series, they determine that adding these decimals cannot be done without error. Their task is then to determine the size...
EngageNY
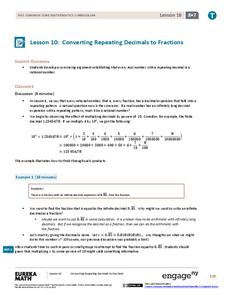
Converting Repeating Decimals to Fractions
Develop a process with your classes for converting repeating decimals to fractions. Through this process, pupils understand that any repeating decimal can be written as a fraction. The 10th activity in this 25-part module helps...
EngageNY
Changing Scales
Pupils determine scale factors from one figure to another and the scale factor in the reverse direction. Scholars compute the percent changes between three figures.
EngageNY
Finding One Hundred Percent Given Another Percent
Class members solve problems to find the whole when given a percent. They use double line numbers and factors of hundred to help break the 100 percent into equal segments.
EngageNY
Understanding Variability When Estimating a Population Proportion
Estimate the proportion in a population using sampling. The 20th installment in a series of 25 introduces how to determine proportions of categorical data within a population. Groups take random samples from a bag of cubes to determine...
EngageNY
Using Sample Data to Compare the Means of Two or More Populations
Determine whether there is a difference between two grades. Teams generate random samples of two grade levels of individuals. Groups use the mean absolute deviation to determine whether there is a meaningful difference between the...
EngageNY
Comparison Shopping—Unit Price and Related Measurement Conversions II
Which rate is greater and by how much? Pupils continue to compare rates to solve problems in the 20th portion of a 29-part series. Rates are presented in a variety of representations either using the same representation or different...
EngageNY
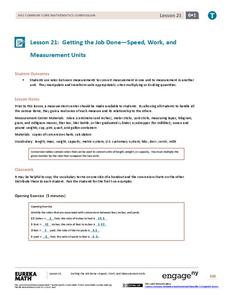
Getting the Job Done—Speed, Work, and Measurement Units
How do you convert from one measurement to another? Pupils use unit rates to convert measurements from one unit to another in the 21st segment in a 29-part series. They convert within the same system to solve length, capacity,...
EngageNY
The Euclidean Algorithm as an Application of the Long Division Algorithm
Individuals learn to apply the Euclidean algorithm to find the greatest common factor of two numbers. Additionally, the lesson connects greatest common factor to the largest square that can be drawn in a rectangle.
EngageNY
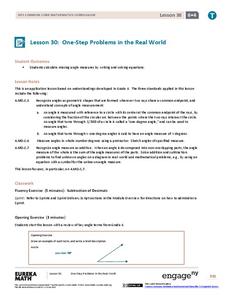
One-Step Problems in the Real World
Mirror, mirror on the wall, which is the fairest resource of them all? Individuals write and solve one-step equations for problems about angle measurement, including those involving mirrors. Both mathematical and real-world problems are...
EngageNY
The Mean as a Balance Point
It's a balancing act! Pupils balance pennies on a ruler to create a physical representation of a dot plot. The scholars then find the distances of the data points from the balance point, the mean.
EngageNY
Understanding Box Plots
Scholars apply the concepts of box plots and dot plots to summarize and describe data distributions. They use the data displays to compare sets of data and determine numerical summaries.
EngageNY
Writing and Evaluating Expressions—Exponents
Bring your young mathematicians into the fold. Scholars conduct an activity folding paper to see the relationship between the number of folds and the number of resulting layers in the 23rd installment of a 36-part module. The results of...
EngageNY
From Equations to Inequalities
Sometimes, equality just doesn't happen. Scholars apply their knowledge of solving equations to identify values that satisfy inequalities in the 34th installment of a 36-part module. They test given sets of numbers to find those that are...
EngageNY
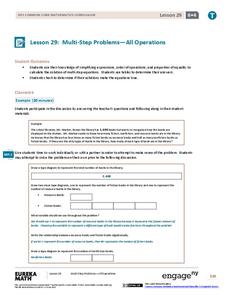
Multi-Step Problems—All Operations
Harness the power of algebra to solve problems. Young mathematicians learn to work out multi-step problems by applying algebraic techniques, such as solving equations and proportions. They use tape diagrams to model the problem to finish...
101 Questions
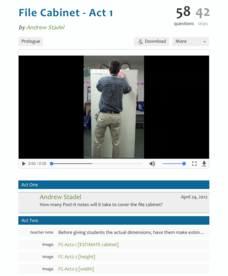
File Cabinet
Take the resource out of the file cabinet. Young mathematicians estimate the number of sticky notes it would take to cover the surface area of a file cabinet. They answer a set of questions on how the number of sticky notes would change...
Mathematics Assessment Project
Bestsize Cans
Traditional calculus problem made simple. In the high school assessment task, learners determine the minimum surface area for a can of a given volume using algebraic and numerical methods to solve the problem. No calculus...
Curated OER
A Day at the Beach
Help learners determine the rate of change for the temperature of sand. They will collect data on the temperature of wet and dry sand over time with a heat lamp overhead. Then make a scatter plot of the data and find a linear model to...
Curated OER
Inquiry Unit: Modeling Maximums and Minimums
Young mathematicians explore the maximun area for patio with the added complexity of finding the mimimum cost for construction. First, they maximize the area of a yard given a limited amount of fence and plot width v. area on a...


