Science 4 Inquiry
At the Top: A Bald Eagle's Diet
Bald eagles are opportunistic predators and eat fish as well as raccoons and other mammals. Pupils learn about bald eagle diets through a simple simulation and videos. They collect and analyze data to understand the adaptability of this...
Curated OER
A Helthy Diet
Learners examine their eating habits and experience analyzing data and drawing conclusions. They construct models of the molecular backbone of saturated and unsaturated fats. In addition, they examine the labels of their food, record...
Curated OER
Food & Science - How Healthy is Your Diet?
Learners experiment with various foods to determine fat and starch content. They rub jam, peanut butter, bananas, and other foods in a small circle on a piece of paper, and observe the results. If there is a high fat content in the...
Curated OER
Diet, Exercise and AIDS
Students research AIDS and the role of diet and exercise with the disease. For this AIDS lesson, students listen to a mini lecture about the diet and exercise needs of people who have AIDS. Students learn about alternative therapies to...
Curated OER
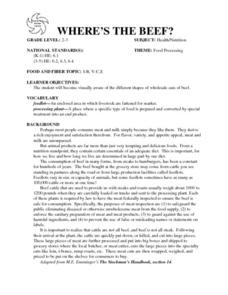
Where's The Beef
Young scholars create and conduct a survey in the community to evaluate the demographics of vegetarians in the community. They compile data, create graphs, calculate percentages, and draw conclusions about the survey data. Students...
Curated OER
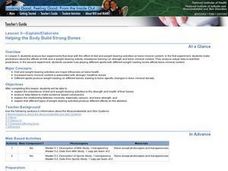
Helping the Body Build Strong Bones
Students explore the effects of diet and weight-bearing activities on bone mineral content. The influence of playing a variety of sports with different weight-loading levels is examined.
Curated OER
Testing for Vitamin C in Different Drinks and Foods
Students examine the importance of vitamin c in their diets and the sources that it comes from. In this vitamin lesson students complete hands on activities, interpret data and make a bar graph.
Curated OER
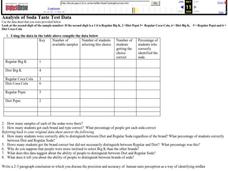
Analysis of Soda Taste Test Data
In this analysis instructional activity, students are given the raw date from a soda taste test experiment. Students use that data to complete a graphic organizer and to answer 8 questions.
Curated OER
Fast Fats: A Nutritional Analysis of America's Obsession with Fast Foods
How do you read a nutritional label? Help high schoolers practice reading nutritional labels on foods so they can calculate the calories in different types of foods. They will also examine the effects of fat on the body and the link to...
Curated OER
EEEK! A Spider!
Youngsters complete a unit of lessons based on the story "Little Miss Muffet." They predict what will happen in the story, and use context clues to look for meaning in the words. They research information about spiders using the Internet...
Curated OER
Energy Balance: The Ins and Outs
Students review data from a 24-hour dietary recall to gain an understanding of the information regarding energy intake and macronutrients.
Curated OER
Food Choices The Pyramid Way
Students develop skills in making nutritionally-sound food choices. Keeping a food diary, they analyze their food intake using the food pyramid as a guide. Students identify and explain the relationship of nutrition to personal health...
Curated OER
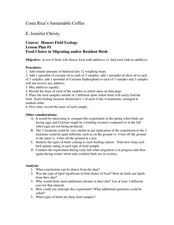
Costa Rica's Sustainable Coffee
Students experiment to see if birds prefer to eat bird seed with additives vs. no additives. In this experimental lesson students test to see if birds notice a difference between additive and no additive food.
Curated OER
Graph a Panther's Diet
Students examine the diet of panthers. In this interpreting data lesson, students collect data on the panther's diet and chart the data in bar and pie graphs.
Curated OER
Mystery Liquids: Linear Function
High schoolers determine the linear equations of the density of water and oil by collecting data on the mass of various volumes of each liquid. They construct scatter plots from the data and use these to write the linear equations for...
Curated OER
See Turtles Nest! See Turtles Hatch!
Students graph data of sea turtles hatching rates from Watamu/Malindi Marine National Park and Reserve in Kenya. In this math lesson, students use real life science data to calculate mean and median values. Students use the data to...
NOAA
Seafood and Human Health
Whether your young biologists realize it or not, humans play a significant role in marine ecosystems. To help them understand this fact children first create graphical representations that show homo sapiens' place in marine food chains,...
Smithsonian Institution
Trait Tracker
Help mice beat the odds with an exciting activity about traits. Biologists discover the role of diet and other factors on animal traits by participating in a simulation activity. Teams collect and evaluate data to understand how certain...
Curated OER
Digestion & Nutrition: a Case Study
Students explore digestion/nutrition and utilize scientific investigation skills. They complete meal logs for several days and graph their results. After analyzing their data, they write formal lab reports.
California Academy of Science
Conservation Island
Why not walk in the footsteps of Teddy Roosevelt and become a conservationist? After discussing issues and reasons for animal extinction, the class creates their own conservation plans. Each small group is given mock data regarding a...
Curated OER
How Can You See Which Soda Has More Sugar?
Sixth graders weigh regular and diet soda to see which one is heavier and therefore which one contains more sugar. In this soda lesson plan, 6th graders discover that regular soda contains more sugar because it weighs more.
Curated OER
Where do Plants Get their Food?
In this where do plants get their food worksheet, students design an experiment that will disprove the idea that plants obtain their food from soil. Students will set up their experiment and design a data table that will record data over...
Curated OER
What Goes in Must Come Out
Students monitor their calorie intake and energy expenditure. They keep track of daily data in a journal and assess and adjust their diets as appropriate.
Curated OER
The Dinosaur Diner
Students explore the food chain. In this dinoaur lesson, students identify charactersitics of an omnivore, carnivore, and herbivore. Students sort dinosaur picture/word cards into groups by their eating characteristics. Students also...


