Curated OER
Using Graphs
In this using graphs worksheet, 9th graders solve and complete 6 different types of problems. First, they determine how the transformation shown moves the graph. Then, students find the interval that is defined given the coordinates....
Curated OER
Time Trials
Learners investigate speed, time and distance. In this algebra lesson, students utilize their knowledge of linear equations to solve problems related to time, speed and distance. This assignment is hands on using two toy race cars.
Mr. E. Science
Motion
An informative presentation covers motion, metric system, conversions, graphing of coordinates and lines, speed, velocity, and acceleration problems, as well as mean calculations. This is the first lesson in a 26-part series.
Kenan Fellows
Introduction to a Flight Computer
Keep your hands on the wheel—at all times! Scholars learn why pilots use a flight computer through a high-flying demonstration. Making calculations for speed, distance, or time is automatic if you know how to use a flight computer.
Curated OER
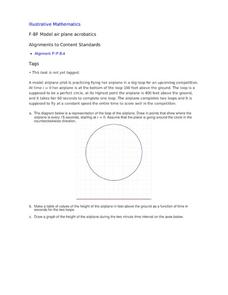
Model Air Plane Acrobatics
Your young airplane enthusiasts will enjoy this collaborative task of graphing an airplane's distance from the ground as it flies in a perfect circle. They will discover that they have graphed a sinusoidal function that comes from the...
CK-12 Foundation
Archery
Archery is believed to be one of the oldest sports in the world at more than 25,000 years old—meaning it can teach your classes a lot! Scholars learn about the forces interacting in the archery simulation. They control the archer's...
Curated OER
Find the Speed of a Protist
Students identify protists under a microscope, and using a stopwatch calculate the speed of a protist from a pond water sample. They use distance and time to identify the speed of a protist, and create a distance versus time graph to...
Curated OER
Length and Speed of a Robot
Students calculate the speed and length of parts of the robot. In this algebra lesson, students measure the length of robots legs. They calculate the time it takes the robot to travel a specific distance.
Curated OER
Walking Home II
Students explore the relationship between distance and time. They analyze a situation involving distance traveled in a given period of time, represent the situation graphically and algebraically, and discuss the concept of slope as a...
Curated OER
The 100 Meter Race Problem
In this meter activity problem, students read a word problem and interpret a graph. They use the derived information to determine time and distance. This one-page activity contains 1 multi-step problem. Answers are...
Curated OER
Physics and Me
Sixth graders compare and contrast mass and weight. In this physics lesson plan, 6th graders calculate speed given distance and time information. They construct a rocket and relate this to Newton's 3rd Law of motion.
Curated OER
Linear Motion 6
In this linear motion worksheet, students answer 12 questions about acceleration, velocity and distance traveled. They interpret diagrams and indicate the location of an object if it has positive, negative or no acceleration. They...
Curated OER
Linear Motion in Class Test Review
In this linear motion activity, learners answer 21 questions about acceleration, velocity, position and time. Students interpret graphs of position vs. time, velocity vs. time and acceleration vs. time. They calculate speed of objects,...
Curated OER
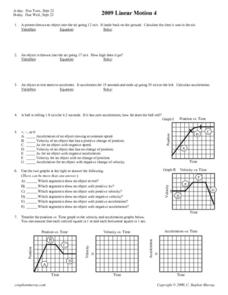
Linear Motion 4
In this linear motion worksheet, learners answer 12 questions including finding acceleration of moving objects, calculating distance objects travel and determining the time of travel. Students interpret graphs of position vs. time,...
Curated OER
How Does the Angle Effect How Fast a Car Will Travel?
For this angle of movement and speed worksheet, students determine at which angle a car will travel the fastest. They test 12 different angles on a toy car and determine from their data which angle is the best for speed.
Curated OER
Momentum
In this momentum worksheet, students answer 17 questions about momentum of objects. They calculate momentum given mass and distance traveled in a given amount of time and they use graphs of position vs. time to find momentum.
Mathematics Vision Project
Module 6: Trigonometric Functions
Create trigonometric functions from circles. The first lesson of the module begins by finding coordinates along a circular path created by a Ferris Wheel. As the lessons progress, pupils graph trigonometric functions and relate them to...
Edmond Public Schools
8th Grade Science Resource Book: Unit 2 - Physics
Get things moving with this extensive collection of physical science resources. Covering the fundamentals of measurement, graphing, lab safety, and experimental design as well as the specific scientific concepts...
EngageNY
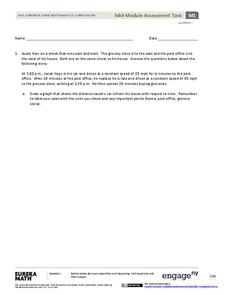
Mid-Module Assessment Task - Algebra 1 (module 1)
Looking for performance tasks to incorporate into your units? With its flexibility, this resource is sure to fit your teaching needs. Use this module as a complete assessment of graphing linear scenarios and polynomial operations, or...
Concord Consortium
All-in-All Problems
Graphs, functions, symbols, and more! Use these strategies to model everything from the flow of a river to the number of cars passing a toll booth. Presented differently but solved similarly, learners consider five different scenarios...
Curated OER
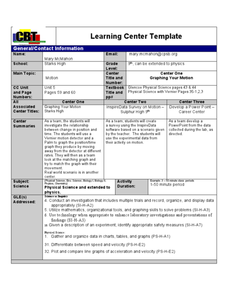
"Graphing Your Motion"
Students study the concepts of motion, velocity, and acceleration through graphing their own movement using LoggerPro. They explain the difference between speed and velocity using the weather vane example. They discover the difference...
Curated OER
Mathematical Techniques - Basic Graphing
Students are introduced to significant figures and how to add, subtract, multiply and divide them. In a group, they practice plotting data points from a table to a graph and labeling all axes. They calculate the slope and y-intercept and...
Curated OER
Tracking Speed
Students collect data for a runner by measuring the time it takes for the runner to run equal distances. After collecting data, students average speeds and accelerations for the runner. Assignment is completed by graphing the data.
Curated OER
Function-al Machines and Spaghetti Graphs
Sixth graders identify the relationship between patterns and functions. In this algebra lesson, 6th graders use a "Functional Machine" to identify the rule. Students use a function table to plot the points using play dough dots.


