Curated OER
Speed and Distance
For this speed worksheet, students create time vs. distance graphs to answer questions about average speed, average velocity, and acceleration. This worksheet has 3 problems to solve.
Curated OER
Measuring Wind Speed
Fourth graders measure wind speed over a week's time uisng a ping pong and a protractor and graph the results. They convert the number of degrees to miles per hour using a scale. They discuss patterns and relationships.
Balanced Assessment
On Averages and Curves
Determine the average on a curve. The class finds graphical representations of averages and expresses them both symbolically and on the graph. The assessment requires class members to justify using average to describe graphs.
Illustrative Mathematics
Buying Bananas, Assessment Version
Practice with unit rates, proportions, and ratios when Carlos purchases an amount of bananas. Learners must interpret a graph to decide whether points on the same line represent similar proportional relationships. Use with lesson plans...
Concord Consortium
Center of Population
Let the resource take center stage in a lesson on population density. Scholars use provided historical data on the center of the US population to see how it shifted over time. They plot the data on a spreadsheet to look the speed of its...
Discovery Education
Cool It!
Adjust the melting time of ice without varying the temperature! Learners experiment with different materials to decide how the materials affect the rate an ice cube melts. They then connect their findings to the conductivity of each...
Curated OER
Describing the Motion of a Battery Powered Cars
Young scholars explore distance a toy car travels by changing the amount of batteries used to power the toy car. In this force and motion lesson, students calculate the average speed of a car while investigating the power from...
Curated OER
Friction This
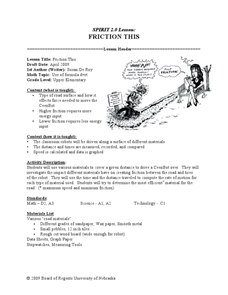
Students investigate road surface and calculate speed. In this algebra lesson, students analyze the roughness of a road and calculate distance and speed based on friction. They relate friction and energy to speed.
Curated OER
Finding Our Top Speed
Students determine the length of time needed to walk or run or walk a given distance. They plot the data on a graph and use the results of data collection to develop the concept of slope.
Curated OER
Bug Race
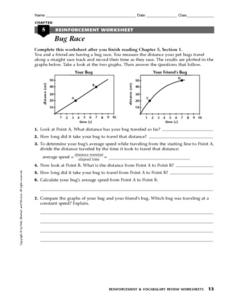
In this motion worksheet, students compare two graphs showing a bug's distance traveled over time. Students calculate the average speed of the bugs and determine which bug was traveling at a constant speed. This worksheet has 1 short...
Curated OER
Let's Go Slopey
Students create a table of values to graph a line. In this algebra lesson, students identify the slope and intercept of a linear equation. They use a Ticalculator to graph their function.
Curated OER
Forces and Motion-The Downhill Racer
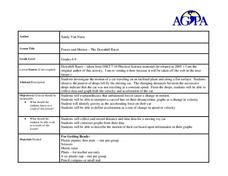
Students calculate a toy car's velocity and acceleration. For this force and motion lesson, students build ramps and attach a dropper to a toy car, which is released down the ramp. Students calculate and graph velocity and acceleration...
Curated OER
Typhoon Project
Young scholars graph and outline the path of a typhoon. In this algebra lesson, students measure the path of the typhoon and create a graph with their data. They analyze the data and make predictions.
Curated OER
Quadratic Applications
For this quadratic applications worksheet, high schoolers complete graphs, charts, comparison charts, and more having to do with quadratic equations. Students complete 5 different activities.
Curated OER
Faster speed-Shorter Time
Students calculate the inverse variation, and speed given the formulas. In this algebra lesson, students investigate properties of conics, focusing on the hyperbola. They identify the distance between the directrix and other parts...
Curated OER
Moving Straight Ahead
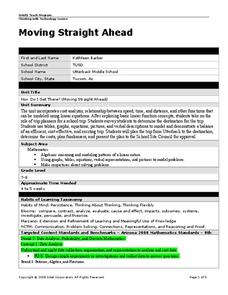
Pupils analyze the relationship between speed, time and distance. In this math instructional activity, students plan a school trip. Pupils determine the efficiency and cost effectiveness of a trip.
Curated OER
Velocity
Students determine the average speed of a toy car as it travels six different distances set up by Students. Three trials are done for each distance. The only requirements is that the longest distance must be at least three times longer...
Curated OER
Earthquake on the Playground
Students investigate earthquakes by examining chart data. In this disasters lesson, students identify the waves that are recorded when an earthquake arises by reading sample graphs in class. Students participate in an...
Curated OER
Energy Costs of Walking and Running
In this energy learning exercise, students use a data chart comparing the energy used while running and walking to create a graph and complete 2 short answer questions.
Curated OER
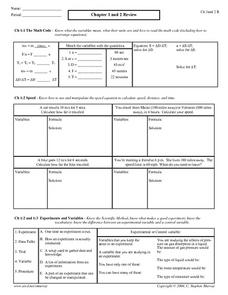
Chapter 1 and 2 Review
In this physics review learning exercise, students complete 24 matching and problem solving questions pertaining to math code, speed, experiments and variables, slope, and acceleration and average speed.
Curated OER
Motion
In this motion worksheet, learners will read 8 statements about displacement and velocity and determine if the statement is true or false. Then students will fill in the blank for 8 statements on motion. Finally, learners will compare...
Curated OER
Cannonball
Young scholars calculate the speed, motion and distance of a projectile. In this geometry lesson, students obtain measurements while calculating velocity. They graph their results and make predictions.
Curated OER
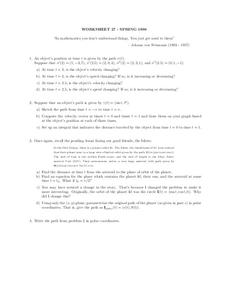
Worksheet 27 - Spring 1996
In this math instructional activity, learners examine the position of an object and then use the formulas to determine its path over time. Then they apply the information in order to determine the traveling path of an asteroid in space.
Curated OER
Worksheet 29
In this math worksheet, learners investigate how time is related to the concept of increasing or decreasing velocity. Then they consider times and answer the questions of whether the velocity is changing.


