Illustrative Mathematics
Writing Constraints
Use this resource to present your number crunchers with how to write a constraint equation and to determine viable solutions. The price of an object limits the amount that can be purchased. The speed at which you walk limits the number...
NASA
Measuring Dark Energy
You're only 10 minutes late? Do you know how much the universe has expanded in those 10 minutes? Scholars graph supernovae based on their redshift and see if the results verify Hubble's Law. If it does confirm it, the universe is...
Curated OER
Sports in Physics: Measuring Velocity in a Mini-Olympics
Eighth graders examine the difference between speed, velocity and acceleration. In this velocity lesson students read and construct a line graph and a bar graph to show information about velocities of sports activities.
Curated OER
Intro to 1D Kinematics with Physlets
Twelfth graders examine illustrations and animations on a Physlets CD in which they must describe motion, analyze graphs, and calculate initial velocity. The Physlet assists in providing active class participation in discussion.
Curated OER
Motion of a Bowling Ball
Students experiment with distance, speed, and motion by graphing the motion of a bowling ball. In this distance versus time graphing lesson, students observe the speed and distance of a rolling ball and graph their findings. They then...
Curated OER
You Drive Me crazy
Students calculate the distance and acceleration of an object. In this algebra lesson, students collect data and create table and graphs to analyze it. They complete a lab as they collect and analyze data on acceleration and distance.
Curated OER
Build Your Own Car
Students design and build their own cars. In this physics lesson, students test their car's speed and make changes when necessary. They graph data and analyze results.
Curated OER
Marble Madness
Students determine the velocity of a marble rolling down the incline. In this physics activity, students identify the independent and dependent variables in the experiment. They construct and analyze a graph.
Curated OER
Galileo: His Times & Beliefs
Students study Galileo and his scientific discoveries. They complete a series of experiments/model constructions, using 17th century equipment and procedures, to "recreate," demonstrate and explore the various discoveries of Galileo.
Curated OER
I'm Inclined to See
Pupils examine motion of a sphere on an inclined plane. In this inclined plane lesson students complete an activity to discover basic relationships.
Curated OER
Graphing Speed
Students use LOGAL motion detector probe and observe a generated graph as a student performs various standard motions, and make measurements of time and distance. They suggest various time and distance measurements which a student can...
Curated OER
Dude, Who Hit My Car?
Learners discuss how investigators solve a hit and run accident. In this physical science lesson, students recreate an accident scene using CEENBot. They collect data from the experiment and formulate conclusion.
Curated OER
Applications of Parabolas
In this algebra worksheet, 11th graders rewrite word problems using algebraic symbols. They relate parabolas to the real world and calculate the breaking distance using the distance formula they come up with. There is answer key.
Curated OER
Animating Motion
Learners apply what they recall about objects in motion by animati ng sequences of pictures that model a set of physical conditions. They animate the orbital motions of the Earth, the space shuttle, and the Moon based on calculations of...
Curriculum Corner
8th Grade Math Common Core Checklist
Ensure your eighth graders get the most out of their math education with this series of Common Core checklists. Rewriting each standard as an "I can" statement, this resource helps teachers keep a record of when each standard was...
Illustrative Mathematics
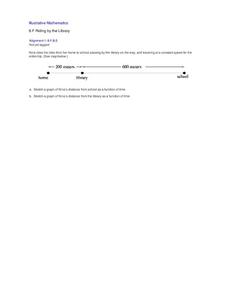
Riding by the Library
Draw a graph that shows the qualitative features of a function that has been described verbally. Make sure learners understand where time is zero and the distance is zero. It may take them some time to understand this concept, so working...
Curated OER
Worksheet 14
In this math worksheet, students analyze a path around a circle. The interval is defined. Students sketch a graph of a given parametric curve. Five application problems give students practice using these concepts in real life situations.
Curated OER
Worksheet 39 - Polar Coordinates
In this polar coordinates worksheet, students graph polar coordinates and determine the values of a given series. This one-page worksheet contains 14 multi-step problems.
Curated OER
Introduction to Lego Robotics
Learners utilize computer programs to operate a simple robot. In this technology activity, students create robots using Lego pieces and simple motors to move them. Learners measure the speed of the robots by running Robolab...
EngageNY
End-of-Module Assessment Task: Grade 8 Module 4
Connect proportional linear equations and systems. The seven-question assessment is the last installment in a 33-part series. The items cover comparing proportional relationships, slope concepts, and simultaneous linear...
Noyce Foundation
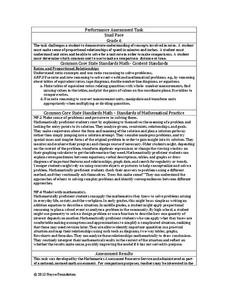
Snail Pace
Slow and steady wins the race? In the assessment task, scholars calculate the rates at which different snails travel in order to find the fastest snail. Hopefully, your class will move much more quickly in finishing the task!
Curated OER
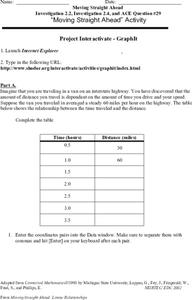
Moving Straight Ahead
In this functions activity, 9th graders solve and complete 24 various types of problems. First, they complete the table with the correct distance for each hour given. Then, students enter the coordinate pairs into the function table...
Curated OER
Gravity, Angles, and Measurement
Students relate math to real life scenarios. In this geometry lesson, students launch a ball tracking each launch using a graph. They analyze their data for speed, angles and distance, trying to improve on each launch.
Curated OER
Earthquake Information
In this earthquake worksheet, students will study a graph showing the travel time and distance traveled for primary and secondary waves of an earthquake. Students will use this graph to complete 8 short answer questions.


