US Department of Commerce
Immigration Nation
People come and people go. Given tabular census data on the annual number of immigrants from four different regions of the world between 2000 and 2010, pupils create double bar graphs and line graphs from the data. They analyze their...
Houghton Mifflin Harcourt
Nature Walk: English Language Development Lessons (Theme 2)
Walking in nature is the theme of a unit designed to support English language development lessons. Scholars look, write, speak, and move to explore topics such as camping, woodland animals, instruments, bodies of water, things found at a...
CK-12 Foundation
Trampoline
Does a trampoline use mostly potential or kinetic energy? Pupils adjust the mass of the jumper, stiffness of the trampoline, and initial jump height in order to answer that question. The simulation displays graphs of the various types of...
Curated OER
Alkanes and Alkenes
For this alkanes worksheet, students use a data table to plot a graph of boiling point against number of carbon atoms. Students define cracking and double bond. This worksheet has 5 short answer questions.
Curated OER
Too Many Tulips
In this graphing information worksheet, students read 6 sentences and then fill in the chart with the appropriate information from the sentences.
Curated OER
What Are We Listening To?
Students gather data from a web site on number of music albums sold by genre for the last two years. They convert these figures to fractions, decimals, and percents, and display the results in bar graphs and pie charts.
Curated OER
Double, Double: Looking at the Effect of Change on Perimeter, Area and Volume
Students explore perimeter, volume, and area. For this math lesson, students explore how changes in dimensions of geometric shapes affect the perimeter, area and volume of the various shapes. Students investigate the results when the...
Curated OER
Let's Graph It
In this let's graph it worksheet, student interactively answer 10 multiple choice questions about graphing data and types of graphs, then click to check their answers.
Curated OER
Double Bar Graph Grid
In this math worksheet, students use this blank double bar graph grid as a tool for any graphing problem. There is a space for the title, labels for each axis and a spot for the key.
Curated OER
Glass Transition in a Rubber Ball
Young scholars illustrate the changes in the properties of a material at its glass transition point. They gather data which they use to construct graphs regarding elastic modules versus absorption modulus, tangent delta, and the effect...
Curated OER
A Penny Saved is a Penny Earned
Learners explore the concept of exponential growth. In this exponential growth instructional activity, students manipulate power models with base 2. Learners discuss what would happen if you doubled a penny over the course of 20 days. ...
Curated OER
Determining the Density of a Liquid
Students find the density of diet soda and regular soda. In this density lesson plan, students measure the mass of a graduated cylinder with 10 different volumes of each soda. They find the mass of the liquid alone and use the volume to...
Federal Reserve Bank
Barbie in the Labor Force
How have the women's share of the labor force and chosen occupations evolved in the United States over the last century? Using census reports, graphs detailing the gender makeup of the labor force, and analysis of the careers of Barbie...
Curated OER
Line 'Em Up!
Students find coordinate points on a grid and create a line graph with those points. This lesson should ideally be used during a unit on various types of graphs. They make and use coordinate systems to specify locations and to describe...
Curated OER
Parabolic Equations
In this parabolic worksheet, learners write an equation of a parabola which satisfies given conditions. They match equations to the correct graph. Students identify the vertex, domain and range of an equation. This one-page worksheet...
PBL Pathways
College Costs
Predict the year that college costs will double in your state using linear modeling. The first part of this two-part project based learning activity asks young mathematicians to use data from the College Board. They graph the data, write...
Curated OER
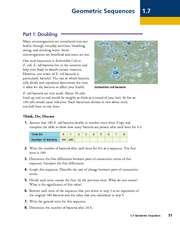
Geometric Sequences - Bacterial Growth
Bring algebra to life with scientific applications. Math minded individuals calculate and graph the time it takes a bacterium to double. They discuss geometric sequences and use a chart to graph their findings. There are 38 questions all...
Curated OER
Exponential Functions
Your algebra learners analyze and interpret the general form and the graph of two functions. The increase of the function due to the multiplicative factor is emphasized.
Curated OER
Activities for a High School Instrumentation Course
The intent of this series of activities is to introduce high schoolers to the field of chemical instrumentaiton. They perform a few basic chemistry lab techniques: pH titration, paper, gas, and liquid chromatography, ultraviolet and...
Curated OER
The Candy Color Caper
Students explore the concept of probability. They calculate the probability of an event happening and graph their results. Students determine the probability of winning a sweepstakes. They construct a bar graph to represent all the...
It's About Time
Factors Affecting Population Size
How do we predict future population growth? Young researchers investigate various factors affecting the size of our population. As they calculate and interpret graphs to determine factors that could potentially affect increases and...
Curated OER
Elastomers: The Best Bungee Cord
Young scholars examine elastomeric polymers in a lab activity in which they design a bungee cord. Students must determine the tensile strength, percent elongation, and plot stress versus strain graphs for their experiments on rubber...
Curated OER
Math - Blank Jeopardy
Double Jeopardy! Review polynomials, statistics, triangles, graphing, mode, median, mean, measurement, slope, distance, and ratio. Note: Have everyone use a white board to do the problems to get a quick check on understanding.
Virginia Department of Education
DNA Structure, Nucleic Acids, and Proteins
What is in that double helix? Explain intricate concepts with a variety of creative activities in a lesson that incorporates multiple steps to cover DNA structure, nucleic acids, and proteins. Pupils explore the history of DNA structure,...
Other popular searches
- Double Bar Graph Activities
- Reading Double Bar Graphs
- Reading Double Line Graphs
- Double Bar Graph Assessment
- Creating Double Bar Graphs
- Definition Double Bar Graph
- Double Bar Graph Worksheets
- Double Bar Graphs Ell
- Double Bar Graphs Animals
- Double Bar Graphs Enrichment
- Double Bar Graphs Reteach
- Double Bar Graphs Worksheets


