Mathed Up!
Scatter Graphs
Make an estimate by getting in line. The class works with scatter plots and lines of best fit to make an estimate for given values. Pupils determine whether there is a positive or negative correlation and draw a best-fit line. Using the...
Curated OER
Ordering Integers
Sixth and seventh graders compare and order integers. After locating integers in a newspaper, they describe examples of negative and positive integers. They draw a thermometer and locate positive and negative integers on the scale. In...
Mathed Up!
Ordering Fractions, Decimals, and Percentages
Give scholars the opportunity to show what they know about ordering fractions, decimals, and percents with a five-page, eight-problem independent practice. With clear instructions and supportive advice, learners are bound for a...
Curated OER
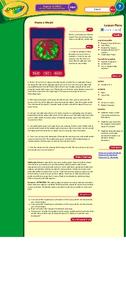
Weave a Wreath
Students follow directions to complete a multi-step process that results in an attractive holiday decoration. For this Christmas art activity lesson, students employ simple measuring and weaving techniques and experiment with the...
Curated OER
Graph Paper Patterns
Young artists divide a piece of graph paper into sections using rectangles, squares, and triangles. They then fill each section with patterns of shape and color. Elementary graders describe how their patterns are organized. Secondary...
Achieve
Fences
Pupils design a fence for a backyard pool. Scholars develop a fence design based on given constraints, determine the amount of material they need, and calculate the cost of the project.
Curriculum Corner
7th Grade Math "I Can" Statement Posters
Translate the Common Core math standards into a series of achievable "I can" statements with this collection of classroom displays. Offering posters for each standard, this resource is a great way to support your seventh graders as...
Curated OER
Scatterplots
For this statistics worksheet, students create a scatter plot based on their analysis of data provided form the space shuttle Challenger disaster. The five page worksheet contains four questions. Answers are not provided.
Mathematics Assessment Project
Middle School Mathematics Test 6
A thorough math test divides the content into two 40-minutes sections, covering material through algebra and geometry. Problems incorporate analysis and applied problem solving.
Curated OER
Area of Combined Shapes - Turtle Combo
High schoolers graph polygons using the name and number of sides. In this geometry lesson, students identify the formula to calculate the area and perimeter of polygons. They relate the formula to different polygons and shapes.
Curated OER
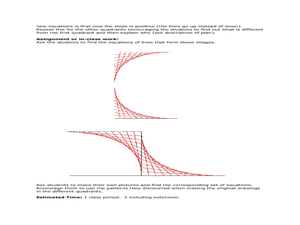
Mathematics of Doodles
Students use the slope and y-intercept to graph lines. In this algebra lesson, students graph linear equations and apply it to solving real life problems.
Curated OER
Deci-order
Fourth graders play a game to practice their decimal number ordering skills. They use their knowledge of the number system to create the biggest decimal number. Students are dealt 3 cards each with the reminaing cards placed face down...


