Curated OER
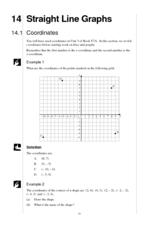
Straight Line Graphs
In this line graphs worksheet, students draw lines for 9 problems then solve 9 additional problems relating to line graphs. Answers are included.
Curated OER
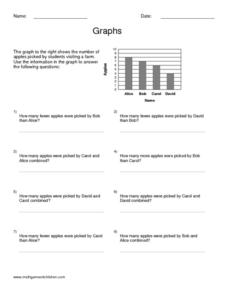
Line and Double Line Graphs: Reteach
In this graphing worksheet, students review the five steps for making a double line graph to display data. Students then use the graph they made following the shapes to answer the three questions.
Curated OER
Straight Line Graphs
Students discover certain equations produce straight lines. In this graphing lesson, students draw axis and problem solve to find coordinates to graph.
EngageNY
Informally Fitting a Line
Discover how trend lines can be useful in understanding relationships between variables with a lesson that covers how to informally fit a trend line to model a relationship given in a scatter plot. Scholars use the trend line to make...
Curated OER
Animal Brains
Do big bodies make big brains? Let your learners decide whether there is an association between body weight and brain weight by putting the data from different animals into a scatterplot. They can remove any outliers and then make a line...
Curated OER
Walking the Plank
This is a cool math activity. Kids collect and interpret data based on a physical act. A board is balanced between a scale and a step, learners record a peer's weight as it decreases while s/he walks further away from the scale. They...
Curated OER
Comparing Data on Graph A and Graph B
Second graders gather and graph data. In this graphing lesson, 2nd graders collect data and graph this information using tally charts, bar graphs, pictographs, or tables. They make predictions about the outcomes.
Curated OER
Graphs
In this algebra instructional activity, students calculate the point of intersection between a circle and a straight line. There are 5 questions with an answer key.
Virginia Department of Education
May I Have Fries with That?
Not all pie graphs are about pies. The class conducts a survey on favorite fast food categories in a lesson plan on data representation. Pupils use the results to create a circle graph.
Exploratorium
Traveling Networks
Show your class the path to understanding graph theory. Scholars learn about basic graph theory using an activity based on the Bridges of Konigberg problem. They draw networks on the playground and decide whether it is possible to travel...
Curated OER
Problem Solving: Graphing Functions
In this graphing functions worksheet, students solve 6 word problems, finding ordered pairs, missing coordinates and numbers, slopes of lines and functions.
Curated OER
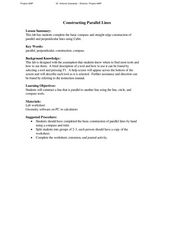
Constructing Parallel Lines
Students construct parallel lines using a protractor and a straightedge. In this geometry lesson, students identify the properties of parallel lines. They use Cabri to graph and observe the lines.
Curated OER
Worksheet Gr4: Linear Equations
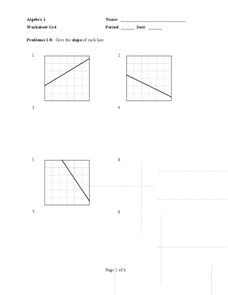
In this linear equations worksheet, students solve 24 short answer problems about slope. Students find the slope of a line given a table, graph, two points, and the intercepts.
Curated OER
Straight Graph Lines: Coordinates
Students access prior knowledge of coordinates. In this coordinates lesson, students graph coordinate points to create a symmetrical figure and of a straight line. Students complete several practice examples.
Curated OER
Basic Algebra and Graphing for Electric Circuits
In this electronics worksheet, students evaluate mathematical expressions to complete 16 short answer and problem solving questions.
Curated OER
Parabolas
High schoolers investigate parabolas and their equations. In this parabolas and their equations lesson, students graph quadratic equations on their graphing calculator. High schoolers find the axis of symmetry of a parabola. Students...
Curated OER
Graphing Integers
Fifth graders complete an integer graphing activity. In this integer graphing lesson, 5th graders use coordinate grids to help them complete linear functions and integer graphing.
Balanced Assessment
A Fishy Story
There's nothing fishy about this resource. In the task, learners use given information about fish prices to create a scatter plot and line of best-fit. Later, they use the information to answer questions about the profit from fish sales.
Curated OER
Graphs
In this algebra instructional activity, students solve linear equations through graphing and quadratic equations through factoring. There are 4 questions dealing with systems of equations.
Curated OER
Graphing Coordinates
Sixth graders practice graphing coordinates. For this geometry lesson, they use the x and y axis to locate points that must be connected in the right sequence to form a straight line.
Curated OER
Symmetrical Designs with Pretzels and Marshmallows
Fifth graders create designs that have lines of symmetry using pretzel and marshmallows. In this symmetry design instructional activity, 5th graders work in groups using graph paper, rulers, and toothpicks to plan their own lines of...
Curated OER
Linear Functions
In this linear function activity, 6th graders solve and complete 3 various types of problems. First, they write the equation of a straight line that passes through a pair of points. Then, students complete each table by filling in the...
Curated OER
Map Your School
Learners participate in a project to map their school. They measure and graph various areas around the school. Students find the longitude and latitude of the school and research the school's history, and highlight special important areas.
Curated OER
Exploring Geometric Patterns and Relationships
Sixth graders explore different geographic relationships in like drawing lines, rays, and parallelograms. This lesson could be used for review because it covers more than one concept. The students should have prior knowledge.


