American Statistical Association
How Long is 30 Seconds?
Is time on your side? Pupils come up with an experiment to test whether their classmates can guess how long it takes for 30 seconds to elapse. They divide the class data into two groups, create box-and-whisker plots, and analyze the...
Curated OER
Telling Time
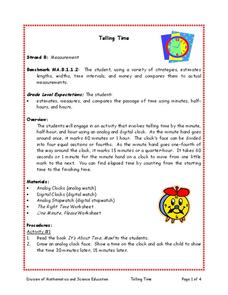
Students estimate, measure, and compare the passage of time using minutes, half hours, and hours. They read the book 'It's About Time, Max!' with the teacher and draw an analog clock face. They show the time and 30 minutes later, 15...
Curated OER
How to Calculate Time
Students complete a worksheet. In this calculations lesson, students learn factual information about computing time with clocks, calendars and eras. Students show their knowledge by completing a worksheet.
Curated OER
Problem Solving - Use a Table
In this time worksheet, 2nd graders use a table that shows the amount of time students act as second grade helpers to answer 3 word problems. They draw or write to explain each answer and complete 1 test prep question.
Curated OER
Not Your Average Average
Students discover that if a distance is traveled in two or more segments at different average speeds, you cannot average the average speeds. Instead the total distance traveled must be divided by the total elapsed time. Students practice...
Curated OER
Sunshine Math- 2
In this math applications worksheet, students solve 8 varied problems that include basic operations, geometry, elapsed time, logic and story problems.
Curated OER
Math Mammoth End of the Year Test - Grade 3
In this comprehensive diagnostic test worksheet, learners examine, study, calculate and solve 38 math problems. They work with a variety of basic math concepts and word problems.
Curated OER
Estimation Zone
Students explore estimation. They estimate distance, weight, temperature and elapsed time. Students record their estimates and justify their estimations wtih a written response. After estimating, students take the actual measurements of...
Curated OER
Solar Flare Reconstruction
For this solar flare reconstruction worksheet, students read about the 'saturation' point of satellite detectors when solar flares are at their most intense phase of brightness. Students are given x-ray flare data and they re-plot the...
Curated OER
Super-Fast Solar Flares!
In this solar flares learning exercise, students observe a sequence of figures of a solar flare observed in 2003 from the Ramaty High Energy Solar Spectroscopic Imager satellite. Students solve 6 problems including finding the scale of...
Curated OER
The Comet Encke Tail Disruption Event
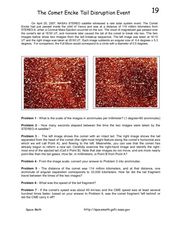
In this comet tail disruption instructional activity, students solve 7 problems using two images from NASA's STEREO satellite showing the breakup of the comet's tail. Students analyze the diagram and use the scale to solve the problems...
Curated OER
The Mysterious Hexagon on Saturn!
In this Saturn learning exercise, students use a photograph of a hexagon feature on Saturn to solve three problems. These include finding the time it takes for the jet stream to complete one circuit around the hexagon, to find the size...
Curated OER
Euler's Method
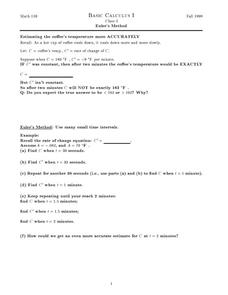
In this Euler's method learning exercise, students use Euler's method to determine one-second time intervals in a rate problem. They explore functions to estimate rate changes in small time intervals. This two-page learning exercise...
Curated OER
Worksheet 2 - Instantaneous Velocity
In this distance worksheet, students determine the distance between two objects, find the average velocity of an object, and define instantaneous velocity. This two-page worksheet contains six two-step problems.
Curated OER
Metric Olympics
Students participate in a Metric Olympics event and use metric measurements to measure actual performances in their events. They throw a plastic straw for a javelin event, participate in a long jump and high jump event, and a variety of...
Curated OER
Driving Directions
In this driving directions worksheet, 5th graders interpret a driving route from Yosemite National Park to Mount Saint Helens National Monument. Students answer five math word problems associated with the route.
Curated OER
Locations of Objects
In this locations of objects worksheet, students solve 5 different problems that include counting objects and determining where each is located. First, they identify the location of each object. Then, students fill-in the correct bubble...
Curated OER
Word Problems
In this word problem instructional activity, 6th graders solve 5 different word problems related to the data table shown. First, they determine the average of the overall scores as shown in the table and the mean of the overall scores....
Curated OER
Variables and Expressions from Around the Cosmos
In this variables and expressions worksheet, students solve 7 problems using different mathematical formulae to find the length of Earth's day in the future, the distance to the galaxy Andromeda, the temperature of a gas cloud emitting...
Curated OER
How Hot Is It?
Fourth graders practice estimating temperatures. They practice in Celsius and Fahrenheit.
Curated OER
A Real Difference
Fifth graders use the Celsius and Fahrenheit thermometers to compare temperature readings. They use the Internet to find the temperatures of selected cities. After data is collected for five days, 5th graders graph the temperatures.


