Curated OER
Heat Transfer and Pollution
Pupils perform computer simulations on air dispersion. In this chemistry lesson plan, students calculate energy transfer based on specific heat and temperature change. They explain the causes of smog.
Curated OER
A Comparison of Cloud Coverage Over Africa
Students use a NASA satellite data to contrast amounts of cloud coverage over different climate regions in Africa. They explore how Earth's major air circulations affect global weather patterns, and relate to local weather patterns.
Colorado State University
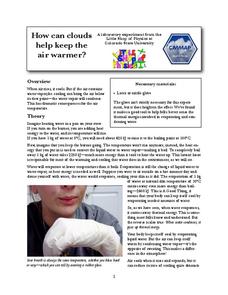
How Can Clouds Keep the Air Warmer?
Condensing water warms the air around it. Young scholars consider this concept as they experiment with air temperature around evaporating and condensing water vapor. They simulate the formation of clouds to experience the associated...
Chicago Botanic Garden
Carbon, Greenhouse Gases, and Climate
Climate models mathematically represent the interactions of the atmosphere, oceans, land, sun, surface, and ice. Part two in the series of four lessons looks at the role greenhouse gases play in keeping Earth warm and has participants...
Curated OER
Storm Clouds-- Fly over a Late Winter Storm onboard a NASA Earth Observing Satellite
Students study cloud data and weather maps to explore cloud activity. In this cloud data lesson plan students locate latitude and longitude coordinates and determine cloud cover percentages.
Curated OER
Weather Watchers
Students identify basic weather instruments and how they are used to record weather data. Students define several vocabulary terms as stated in lesson. Students use basic instruments to record weather data in their area. Students use the...
Curated OER
Radiation Comparison Before and After 9-11
Using the NASA website, class members try to determine if changes could be detected in cloud cover, temperature, and/or radiation measurements due to the lack of contrails that resulted from the halt in air traffic after the attacks...
Curated OER
Green House Effect
Students read about the green house effect and how our environment is deteriorating and what we can do to help it. In this green house effect lesson plan, students conduct a home and school energy audit, and create a rap.
Curated OER
Science Word Search
In this science worksheet, learners locate and identify various vocabulary terms related to earth science. There are 44 words/phrases located in the puzzle.
Curated OER
Wave Types and Characteristics
Ninth graders identify the different parts of a wave. In this physics activity, 9th graders observe wave behavior as it travels through a boundary. They determine the relationship between wavelength, frequency and velocity.
American Museum of Natural History
Climate Change
It actually is possible to have too much of a good thing when it comes to climate change. A slide show lesson describes how burning fossil fuels contributes to climate change. Individuals read about the scientific process and the...
University of Colorado
Can Photosynthesis Occur at Saturn?
In the 19th activity of 22, learners determine if distance from a light source affects photosynthesis. Participants capture oxygen in straws and find that the amount of water the gas displaces is proportional to the rate of photosynthesis.
Curated OER
Hurricanes As Heat Engines
Students examine sea surface temperatures to see how hurricanes get heat from the oceans surface. In this hurricanes lesson students use the Internet to find data and make line plots.
PHET
AM Radio Ionosphere Station
Tune in! Young scientists use an AM radio at home to monitor solar output. The long-term project would be ideal in a flipped classroom or as an out-of-class project.
Discovery Education
Smoke on the Water
How do clouds form? Learners demonstrate the formation of clouds and the water cycle by testing four different setups in a plastic bottle. They identify the key components of a cloud to help them understand the process of cloud...
National Wildlife Federation
The Amazing Adventures of Carbon: How Carbon Cycles through the Earth
Here's a stat for your pupils: 18 percent of the human body is carbon! Part 10 in the series of 12 takes pairs on an adventure through the carbon cycle. After a class reading about carbon, pairs read and choose their own adventure...
Curated OER
Physics- global warming
Students discuss the concept of global warming and view a multimedia clip on the global warming phenomenon. They statistically analyze mean temperature data and compare a given set of data. Data on atmospheric CO2 is done then they...
Curated OER
A Message in a Bottle
Young scholars investigate the motion of water currents by mapping the possible movement of messages cast into the ocean in bottles.They accurately plot the appearance of bottles on a world map and illustrate the flow of an ocean...
Curated OER
Science: Trouble in the Troposphere
Students research a NASA Website and record information about an assigned city's tropospheric ozone residual monthly climate. In groups, they graph the information for the past year. They form new groups and compare their city's...
Curated OER
How Much Carbon is Held by the World's Forests?
Seventh graders identify how much carbon is held by the world's forests. For this forestry activity, 7th graders study the carbon cycle and discuss what role humans have had on climate change. Students write a one page paper on how...
Curated OER
Diurnal Temperature Changes and Water Vapor Content
Students examine the greenhouse effect, as they determine how moisture in the air affects the diurnal temperature range. Their investigation help them to explain different climatological regimes of both the Southern Great Plains and the...
Curated OER
Convection
Students experiment with the cyclic process of convection and apply the principal to everyday events.
Curated OER
Trouble in the Troposphere
Young scholars create graphs using NASA data, compare ozone levels of several U.S. cities, analyze and evaluate the data and predict trends based on the data, and discuss and describe how human activities have modified Earth's air quality.
Curated OER
Trends of Snow Cover and Temperature in Alaska
Students compare NASA satellite data observations with student surface measurements of snow cover and temperature. They practice data collection, data correlations, and making scientific predictions.


