Curated OER
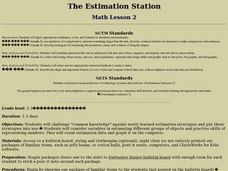
The Estimation Station
Students challenge "common knowledge" against newly learned estimation strategies and put those strategies into use. They consider variables in estimating different groups of objects and practice skills of representing numbers.
Curated OER
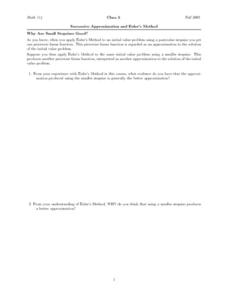
Successive Approximation and Euler's Method
In this approximation worksheet, students use the Euler's method to interpret a piecewise linear function. They explore why the approximation produced using a smaller stepsize is a better approximation. This four-page worksheet...
Curated OER
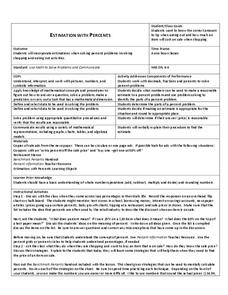
Estimation With Percents
Pupils examine percents. In this percents lesson, students will estimate percentages. Using advertisements from a newspaper, pupils problem solve to determine the final price of a sale item.
Curated OER
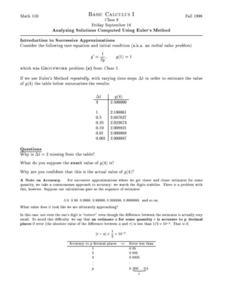
Analyzing Solutions Computed Using Euler's Method
In this analyzing solutions learning exercise, students use Euler's Method to estimate the value of given functions. They estimate solutions using the piecewise-linear function model and sketch the information onto a graph. This...
Curated OER
Unit 5: Worksheet 5 - Estimation & Probability
In this estimation worksheet, students interpret given data and estimate fish populations. Students write a conclusion of their findings. Afterwards, they determine the probability of given events. This two-page worksheet contains...
Curated OER
Object Graphs
Students identify geometric shapes, demonstrate construction of an object graph, compare sets of objects, estimate which student has the most geometric shapes in his or her bag, and play computer game Jump Start Kindergarten.
Curated OER
Pumpkin Problems
Students participate in a lesson that has the intention of working on estimation skills. They use pumpkins to estimate the number of seeds are inside. They collect data for each pumpkin and compare it to the estimation. Students question...
Curated OER
Popcorn Math
Everyone loves popcorn! Use this treat to teach math concepts including place value, estimating, graphing, and volume. Eight possible activities are included, and they can be modified to fit all grade levels.
Curated OER
Data With Candy
Students, while utilizing the classroom and the computer lab with a bag of colored candy, gather and interpret data, calculate averages and draw conclusions and draw a bar graph. They estimate how many candies are in the bag, what...
Curated OER
One Size Fits All, Part 1
Can you tell how tall someone is just by looking at their feet? In this activity, young mathematicians measure their height, arm span, and foot size, graph their findings, and answer questions about how these measurements are related....
Curated OER
Ordering Rational Numbers and Finding Their Approximate
Middle schoolers explore the concept of ordering rational numbers on a number line. They represent rational numbers as decimals and percents. Pupils create a foldable about converting fractions to decimals to percents, and use a...
Curated OER
Introduction to Graphing
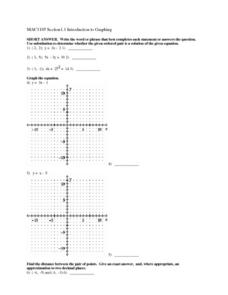
In this graphing worksheet, learners graph linear equations on a coordinate plane. Students identify the slope and y-intercept of each problem, find the midpoint of a line, and the distance between given points. Given an equation,...
Curated OER
Linear Equations and Functions - Area and Perimeter
Students use information they know to decorate a room at a reasonable cost by comparing the cost of companies for a decorating job. In this cost lesson plan, students take into consideration the area and perimeter of the room.
EngageNY
Decimal Expansion of Pi
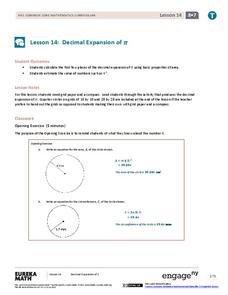
Develop a better understanding of the value of pi. Learners explore the area of a circle using estimation and graph paper. While continuing to estimate the area of the circle using smaller and smaller grids, the number pi emerges.
Curriculum Corner
8th Grade Math "I Can" Statement Posters
Clarify the Common Core standards for your eighth grade mathematicians with this series of classroom displays. By rewriting each standard as an achievable "I can" statement, these posters give students clear goals to work toward...
Virginia Department of Education
Middle School Mathematics Vocabulary Word Wall Cards
Having a good working knowledge of math vocabulary is so important for learners as they progress through different levels of mathematical learning. Here is 125 pages worth of wonderfully constructed vocabulary and concept review cards....
Curated OER
Practice Estimating!
Bring math home with this interative estimating worksheet! Scholars make educated guesses about the number of six household items: crayons in a crayon box, keys on a key ring, coins in a piggy bank, trees in the yard, pictures on the...
Curated OER
Differentiability and Linear Approximation
In this linear approximation instructional activity, students determine the derivative of a function and explore properties of the error when using a tangent line to approximate a function graph. This two-page instructional activity...
Curated OER
Explora-Pond: Surface Area
Students estimate the surface area of a pond using ratios and chance methods of estimation. They gain insight into how well estimations based on chance outcomes match the average of a maximum area estimation and a minimum area estimation.
Curated OER
Applied Science - Science and Math Lab
Students make a prediction. In this applied science lesson, students guess the number of items in a jar. Students create a bar graph to show the predictions and the actual amounts.
Curated OER
Sorting and Analyzing
Students explore sorting and graphing. For this math lesson, students create and analyze a class bar graph about their birthday months. They then estimate and sort candies to make and analyze their own bar graph.
Curated OER
ESTIMATION
Students practice estimating and counting and using a ruler to measure distance.
Curated OER
Go The Distance Car Construction
Young scholars build and program a car to drive a specific challenge distance.They must at the end of the lesson, have the car that stops the closest to a challenge distance.
Concord Consortium
Rule of 72
Find an easier way to double it. Using the price of an item and the Consumer Price Index, learners determine how long it will be for the price to double. Scholars calculate the length of time it would take for the price to double using a...


