Curated OER
ESTIMATION
Pupils practice estimating and counting and using a ruler to measure distance.
Curated OER
Go The Distance Car Construction
Students build and program a car to drive a specific challenge distance.They must at the end of the lesson, have the car that stops the closest to a challenge distance.
Concord Consortium
Rule of 72
Find an easier way to double it. Using the price of an item and the Consumer Price Index, learners determine how long it will be for the price to double. Scholars calculate the length of time it would take for the price to double using a...
Curated OER
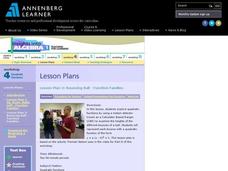
Bouncing Ball : Function Families
A bouncing ball serves as more than entertainment when learning to apply quadratic functions to real-world events. This is the second of a two-part lesson, which can also be accessed from the website. The instructions say to measure the...
PBS
Button, Button
Youngsters count, classify, and estimate quantities using buttons after a read aloud of The Button Box by Margarette S. Reid. They discuss the difference between guessing and estimating. Based on an experiment, they predict the number of...
Curated OER
Linear Approximation
In this algebra worksheet, students solve problems using estimation and the derivative. They calculate the critical points, domain and indicated intervals. They calculate the first and second derivative. There are 5 problems.
Curated OER
Graphs and Measurement
Tenth graders analyze graphs and by comparing trees. In this geometry lesson, 10th graders investigate the use of different graphs using bar and regular graphs. They work groups at the computer.
Curated OER
Virtual Field Trip
This hands-on resource has future trip planners analyze graphs of mileage, gasoline costs, and travel time on different routes. While this was originally designed for a problem-solving exercise using a Michigan map, it could be used as a...
Curated OER
Environmental Graphing
Learners experiment with graphing. In this graphing introduction lesson, students complete four activities: 1) a bar graph based on class birthdays 2) an estimation graph of the raisins in raisin bread 3) another estimation example with...
Curated OER
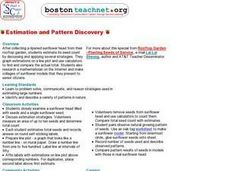
Estimation and Pattern Discovery
Pupils collect sunflower heads from their community garden. They estimate its seed count using different strategies. They graph their estimations on a graph and use calculators to find the actual total.
Curated OER
The Sum of Our Integer Intelligences
Young mathematicians explore integers. They review adding integers through engaging in mathematical labs. Each lab station is designed to reflect one of the multiple intelligences. Resources for all activities are provided.
CK-12 Foundation
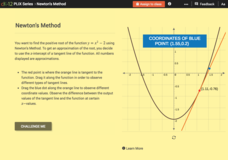
Newton's Method
Use an iterative process to find an approximation of a square root. Pupils use the interactive to find an approximation to find the positive root of a quadratic function with Newton's method. With the graphs, learners position the...
University of Georgia
Freezing and Melting of Water
Examine the behavior of energy as water freezes and melts. An engaging activity provides a hands-on experience to learners. Collaborative groups collect data and analyze the graphs of the temperature of water as it freezes and then...
Noyce Foundation
Ducklings
The class gets their mean and median all in a row with an assessment task that uses a population of ducklings to work with data displays and measures of central tendency. Pupils create a frequency chart and calculate the mean and median....
Shodor Education Foundation
InteGreat
Hands-on investigation of Riemann sums becomes possible without intensive arithmetic gymnastics with this interactive lesson plan. Learners manipulate online graphing tools to develop and test theories about right, left, and midpoint...
Inside Mathematics
Archery
Put the better archer in a box. The performance task has pupils compare the performance of two archers using box-and-whisker plots. The resource includes sample responses that are useful in comparing individuals' work to others.
Curated OER
Exponential Growth versus Linear Growth II
Your algebra learners discover that exponential functions, with a base larger than one, outgrow linear functions when the inputs increase sufficiently. Their analysis includes using a graphing calculator to produce tables.
Virginia Department of Education
Mathematics Vocabulary Cards - Grade 2
Augment your math curriculum with posters detailing several concepts important to second grade math. Each poster features one math term from geometry, measurement, probability and statistics, computation and estimation, numbers and...
Noyce Foundation
Sewing
Sew up your unit on operations with decimals using this assessment task. Young mathematicians use given rules to determine the amount of fabric they need to sew a pair of pants. They must also fill in a partially complete bill for...
Noyce Foundation
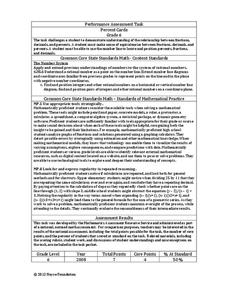
Percent Cards
Explore different representations of numbers. Scholars convert between fractions, decimals, and percents, and then use these conversions to plot the values on a horizontal number line.
Inside Mathematics
Patterns in Prague
Designers in Prague are not diagonally challenged. The mini-assessment provides a complex pattern made from blocks. Individuals use the pattern to find the area and perimeter of the design. To find the perimeter, they use the Pythagorean...
Achieve
Yogurt Packaging
Food companies understand how to use math to their advantage. Learners explore the math related to the packaging and serving size of yogurt. They then use unit analysis and percent values to make decisions on the product development.
Illustrative Mathematics
Cynthia's Perfect Punch
Using a real-world example, this problem illustrates the thought process that learners need to engage in to understand adding mixed numbers with common denominators. First by looking at estimation, and then by drawing models that...
Curated OER
Jelly Belly: What a Wonderful "Bean"!
Young scholars explore how jelly beans are produced. They discuss the origins of the jelly bean and view a video about how jelly beans are prepared, tested, shaped, finished, and shipped and estimate the amount of jelly beans in a jar...


