Resources for Educators
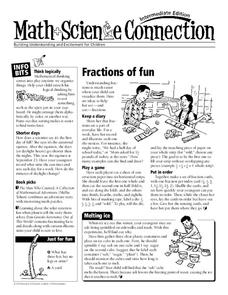
Fractions of Fun
Reinforce concepts and encourage learner engagement with a collection of math games, science experiments, and cross curricular activities. In one fun resource, learners sort objects, keep a diary of everyday fractions, play a game using...
Curated OER
Design Explorations: Frieze Patterns
Middle schoolers will explore frieze patterns. A frieze pattern is a mathematical concept to classify designs on two-dimensional surfaces, which are repetitive in one direction, based on the symmetries in the pattern. They will explore...
BBC
Rights and Responsibilities
Middle and high schoolers engage in a lesson about rights and responsibilities, and the differences between them. After a class discussion, pupils break off into pairs and come up with mimes that respect or abuse a specific right such...
Curated OER
Looking for More Clues
Fifth graders explore how to collect data and display it on a bar and circle graph.
Curated OER
Designing Detectives
Third graders explore the idea of formulating a hypothesis and designing an experiment to test the hypothesis.
Curated OER
Sampling Snoops
Students practice formulating a hypothesis and designing an experiment to test the hypothesis. They identify several sampling techniques they can use to test their hypotheses.
Curated OER
Opening the Case
Students participate in a class survey and then design an experiment and use graphs and statistics to assist them in solving a problem. They organize the results of the survey in a stem-and-leaf plot and find the range, median, mean, and...
Curated OER
The Guise of a Graph Gumshoe
Eighth graders practice constructing bar, circle, and box-and-whisker graphs. They practice reading and interpreting data displays and explore how different displays of data can lead to different interpretations.


