Curated OER
Graphing and Analysis of Water Quality Reports
Young scholars practice making graphs and interpreting them. They compare and contrast different sets of data. They use Microsoft Excel to create different types of graphs.
Curated OER
The Box with the Greatest Volume
Students use measurement tools to measure the nearest 16th of an inch. They connect fractions and their decimal equivalents and compare this with other decimals. Finally, the class uses algebraic concepts and formulas to solve problems.
Curated OER
ICT Activity 17
Eighth graders use a spreadsheet for the first time. They work on a selected environmental issues as their theme. Students prepare costs or income for an event that raises money for an environmental issue. They use the costs and income...
Curated OER
Graphing the Standard Curve
Srudents demonstrate analysis of colorimetric assay results by analyzing them using a computer graphing program and demonstrate application of standard curves by finding other areas of science that can utilize standard curves in analysis...
Curated OER
Understanding Food Labels
Students determine the number of calories, serving size, and vitamins and minerals in different food products and use this information to create a formula determining the number of calories per serving size and the daily percentages of...
Curated OER
Dissolved Oxygen Lesson
Students investigate what dissolved oxygen is and why it is important to aquatic life and what factors influence levels of dissolved oxygen in a lake. They study how to use MS Excel to make charts to show trends and correlations.
Curated OER
Calculating the Area of a Rectangle
A quick definition and the formula for finding the are of a rectangle is provided at the top of this worksheet. After reading the description, 4th graders must find the area of the 3 given rectangles by adding or multiplying. This is an...
Curated OER
WORKING WITH WORKBOOKS
Students work through problems in the textbook and teacher-made problems to reinforce the new learning. They turn in practice problems to instructor to be checked for accuracy and evidence of understanding
Chicago Botanic Garden
Micro-GEEBITT Climate Activity
A truly hands-on and inquiry based learning activity bridges all the lessons in the series together. Beginning with a discussion on average global temperatures, young meteorologists use real-world data to analyze climate trends in order...
Utah Education Network (UEN)
Candies R Us
A box is fun to make, especially when it's a candy box! These activities help to cement understanding of the difference between surface area and volume. Have individuals measure the surface area of their box in two-dimensions before...
Discovery Education
Sonar & Echolocation
A well-designed, comprehensive, and attractive slide show supports direct instruction on how sonar and echolocation work. Contained within the slides are links to interactive websites and instructions for using apps on a mobile device to...
PBL Pathways
Students and Teachers
Predict the future of education through a mathematical analysis. Using a project-based learning strategy, classes examine the pattern of student-to-teacher ratios over a period of years. Provided with the relevant data, learners create a...
National Council of Teachers of Mathematics
National Debt and Wars
Take a functional approach to the national debt. Learners collect information about the national debt by decade and plot the data. They determine whether an exponential curve is a good fit for the data by comparing the percent changes...
Curated OER
Gettin' Through Thursday
Have your class explore active reading strategies! For this guided reading lesson, learners make personal connections to characters having a bad day as a prior knowledge activation discussion. After reading Gettin' Through Thursday,...
Curated OER
Babies: What Do They Cost?
This is a great exercise to give your class a bit of a reality check about having a baby. Few of them realize what a tremendous expense it is for the first year alone. Have them estimate what they think it will cost before giving them...
PBL Pathways
Doctors and Nurses
How many nurses does it take to support one doctor? A project-based activity asks learners to analyze state data to answer this question. Classes create polynomial functions from the data of doctors and nurses over a seven-year...
National Research Center for Career and Technical Education
Depreciation (Double Declining)
Have you ever been told that your new car begins to lose its value as soon as you drive it off the lot? Aspiring accountants take on the concepts of depreciation and book value through an easy-to-deliver career and technology lesson. The...
Radford University
Sleep and Teen Obesity: Is there a Correlation?
Does the number of calories you eat affect the total time you sleep? Young mathematicians tackle this question by collecting their own data and making comparisons between others in the class through building scatter plots and regression...
Curated OER
Down the Drain: How Much Water Do You Use?
Participate in an Internet-based project to share information about water usage with other young scholars. Collect information about water usage and compare it to the average used by people in other parts of the world.
Illustrative Mathematics
Complex number patterns
Start off with the definition of the imaginary number i, then have your class practice simplifying expressions involving powers of i and look for patterns. See how the cyclic nature of powers of i translate to sums of powers of i.
Curated OER
Roofing and Right Triangles
Students use models and symbols to represent properties of the Pythagorean Theorem. In this right triangle lesson plan, students connect real jobs to properties of right triangles. They solve word problems applying the correct ratios and...
Curated OER
Lunch Menu Calories tracking project
In this lunch menu activity, students make a spreadsheet where they count the calories of different food items on the lunch menu, chart their findings, and answer short answer questions. Students answer 5 questions.
Curated OER
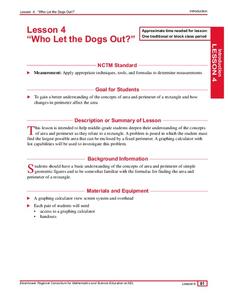
Who Let the Dogs Out?
Students examine the concepts of area and perimeter and how they relate to a rectangle. They find the largest possible area that can be enclosed by a fixed perimeter and complete a worksheet as well as create a table of all the possible...
Curated OER
How Much Does That Car Cost?
Students calculate how much it costs to buy a used car and finance it through a bank. They select a car from the newspaper, conduct Internet research on current auto loan interest information for four different states, and create a...
Other popular searches
- Microsoft Excel Formulas
- Teaching Excel Formulas
- Excel Formulas and Functions
- Writing Excel Formulas


