Curated OER
Get a Half-Life Student Worksheet
Young scientists use a worksheet to help them perform a lab on the decay of a radioactive element. The worksheet serves as both a task guide and a lab sheet for pairs of learners. This activity requires a calculator and has excellent...
Curated OER
Is Portland, Oregon Experiencing Global Warming?
Students use data to determine if the climate in Portland has changed over the years. In this weather lesson students complete line graphs and study long wave radiation.
Curated OER
How Do Plants Grow?
Students investigate plant growth. In this plant growth lesson, students investigate what would happen to plants if they did not have water and sunlight. Students conduct experiments to determine what plants need. Students create a...
Curated OER
Analyzing Tree Rings to Determine Climate Change
Students examine how to locate and access data sets. For this climate change lesson students import data into Excel and graph it.
Curated OER
Dental Detectives
First graders explore the theme of dental health and hygeine. They make tooth loss predictions, count lost teeth, and graph tooth loss. In addition, they listen to dental health stories, read online stories, create spreadsheets, and play...
Curated OER
Creating Climographs
Students use satellite data to compare precipitation and surface temperatures on different islands. For this satellite lesson students create graphs and explain the differences between weather and climate.
Curated OER
Carbon Monoxide and Population Density
Tenth graders investigate the carbon monoxide level at a fixed latitude. They determine if there is a relationship to population density. They download data sets and generate a graph. They determine a link between human activity and...
Curated OER
Weather instruments
Young scholars explore weather instruments. In this weather lesson plan, students make rain gauges, anemometers, and barometers following the instructions given in the lesson plan. Young scholars set up a weather station using their...
Polar Trec
Temperature Profile above the South Pole
Collecting and understanding data is a big part of understanding the world and how it changes. To better grasp what temperatures are changing and how they affect global populations, learners create a graph based on the date provided....
Curated OER
Think GREEN - Utilizing Renewable Solar Energy
Students use data to find the best renewable energy potential. In this solar energy lesson students import data into Excel and explain how solar energy is beneficial.
Curated OER
Does Humidity Affect Cloud Formation?
Students use S'COOL data to identify factors that affect cloud formation. They find a data set using the S'COOL database , and use Excel to manipulate the data. Student isolate relevant data, create meaningful graphs from a spreadsheet,...
Curated OER
Polar Bears in Peril - Climate Change Culprit?
Students explore the changes in sea ice over several years. In this life science lesson, students review and examine 20 years of data. They use Excel to graph data and analyze trends.
Curated OER
Mapping the Bone Field: An Area and Scale Exercise
Here is an excellent cross-curricular lesson. Learners relate multiplication to area by making a grid on graph paper, and then creating the same grid in real space outside in the school yard.
Curated OER
Trends of Snow Cover and Temperature in Alaska
Students gather historical snow cover and temperature data from the MY NASA DATA Web site. They compare this data to data gathered using ground measurements from the ALISON Web site for Shageluk Lake. They graph both sets of data and...
Curated OER
Comparing the Effects of El Nino and La Nina
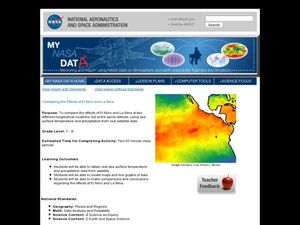
Students examine the differences between an El Nino and La Nina year. For this investigative lesson students create maps and graphs of the data they obtained.
Curated OER
Using My Nasa Data To Determine Volcanic Activity
Students use NASA satellite data of optical depth as a tool to determine volcanic activity on Reunion Island during 2000-2001. They access the data and utilize Excel to create a graph that has optical depth as a function of time for the...
Curated OER
Skyscraper Capers
Students discuss skyscrapers and listen as the teacher introduces the project. They use the Internet to perform research on one skyscraper. Students use information they gather to create a brochure of their building . They create an...
Curated OER
The Racing Heart
Fifth graders locate their own pulse rate from their carotid or radial artery, and graph their pulse rates after completing various exercise activities. They graph their data on a pie graph using Microsoft Excel software.
Curated OER
Graphing the Standard Curve
Young scholars analyze colorimetric using a computer program. In this science lesson, students show application of standard curves by finding other areas of science where standard curve is analyzed.
Curated OER
Temperature Graphing
Students analyze temperature variations throughout the world by using computer graphing of select major national and international cities. After analyzing their findings, students write a paragraph explaining their data.
Curated OER
Graph the Density of Fruit
Fifth graders review the definition of mass and volume. They calculate and graph the density of various types of fruit while working in groups on a spreadsheet program. They look at how size of the fruit can be similar but the weight is...
Curated OER
Toy Dissection Graph
Students explore simple machines and how they are made. They examine the parts of the simple machine and collect information about its parts. Using Excel, students create circle and bar graphs from the collected data.
Curated OER
Seasons and Cloud Cover, Are They Related?
Students use NASA satellite data to see cloud cover over Africa. In this seasons lesson students access data and import it into Excel.
Curated OER
Precipitation in Michigan Cities
Third graders investigate the rainfall amounts in four Michigan cities to observe how cities near lakes are affected differently by precipitation than those that are inland. They record the rainfall for the cities over an eight day...
Other popular searches
- Circle Graph in Excel
- Excel Graphs and Charts
- Excel Graphs Eye Color
- Free Excel Graphs
- Excel Graphs M&m
- Creating Graphs in Excel
- Creating Excel Graphs
- Scatter Plot Graphs Excel
- Excel Graphs Mm
- Bi Excel Graphs
- Data Graphs on Microsoft Excel
- Making Graphs With Excel


