Hi, what do you want to do?
Curated OER
The Box with the Greatest Volume
Learners use measurement tools to measure the nearest 16th of an inch. They connect fractions and their decimal equivalents and compare this with other decimals. Finally, the class uses algebraic concepts and formulas to solve problems.
Curated OER
Go Yankees!
Students use the internet to research the New York Yankees baseball team. After gathering their information, they discuss the challenges faced by the team and how they were overcome. They end the lesson by examining the math and...
Curated OER
1Word and Letter Match Puzzle
In this word and letter match activity, students match groups of 3 letters to words that contain each set. A reference web site is given for additional activities.
National Health Museum
Access Excellence: Graphing Frog Respiration
This is a lesson plan for a science lab recording and graphing the respiration of frogs. Includes background information for teachers, preparation information, and detailed explanation of the activity.
TeachEngineering
Teach Engineering: Using Graph Theory to Analyze Drama
Students analyze dramatic works using graph theory. They gather data, record it in Microsoft Excel and use Cytoscape (a free, downloadable application) to generate graphs that visually illustrate the key characters (nodes) and...
TeachEngineering
Teach Engineering: Graphing Your Social Network
Students analyze their social networks using graph theory. They gather data on their own social relationships, either from Facebook interactions or the interactions they have throughout the course of a day, recording it in Microsoft...
Other
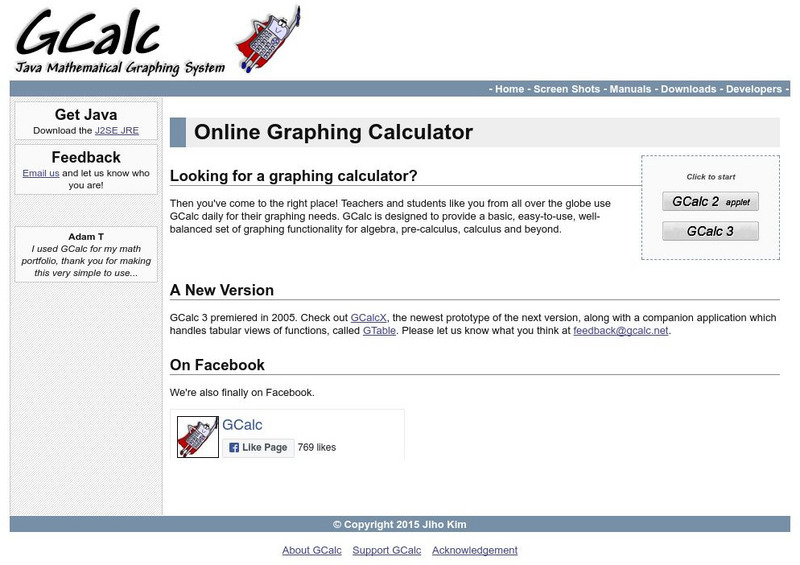
G Calc: Java Online Graphing Calculator
This free online graphics calculator is an excellent resource to aid with studies in algebra, calculus, trigonometry, etc.
Science Education Resource Center at Carleton College
Serc: Exploring Regional Differences in Climate Change
Learners create a set of graphs that facilitate comparison of climate change predicted for various states. They also use Microsoft Excel to create a graph showing precipitation data.
Other
Lt Technologies: Creating Pictographs With Excel
Concise set of directions teaching how to create a basic pictograph using Microsoft Excel.
ClassFlow
Class Flow: Ice Cream Bar Graph
[Free Registration/Login Required] This flipchart reviews bar graphs, how to create them and read them. Excellent activity to get your students involved in a tasty math activity!
University of Vienna (Austria)
Maths Online: Recognize Functions 3
An excellent place to test your ability to recognize the graphs of sine and cosine and their various associated forms. A Java applet is also included to plot your own function.
Other
Laus Dnet: Grade 5 Excel Lesson Plan
In this online activity, students will survey students in their school to determine their favorite type of hand-held ice cream. Before performing the survey, students will make predictions about which ice creams they think will be the...
That Quiz
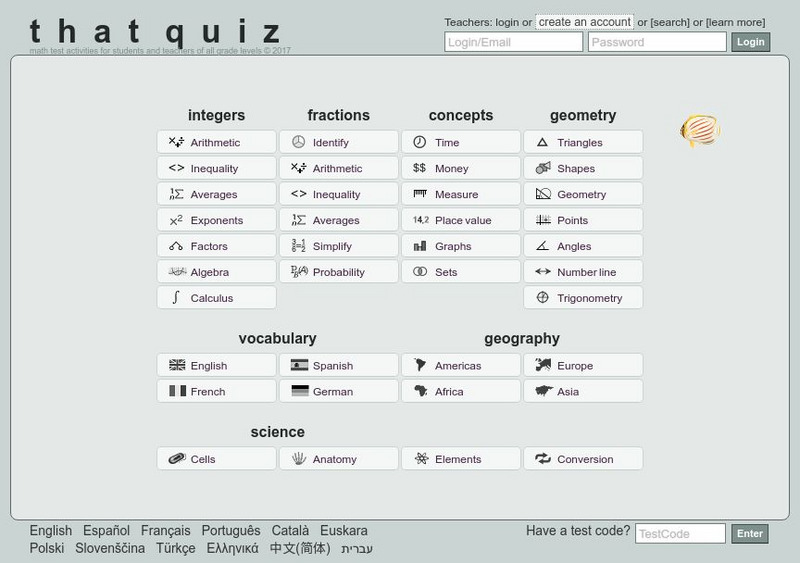
That Quiz
ThatQuiz is an excellent assessment tool for teachers and students. At this site, teachers can create individualized or group assessments on a variety of math topics. Students take these practice assessments directly online and receive...
Texas Instruments
Texas Instruments: Math Today the Next Frontier for Flight
This activity provides students the opportunity to gain experience in creating circle graphs on the calculator and provides an excellent real-world review of computation with percents.
Science Education Resource Center at Carleton College
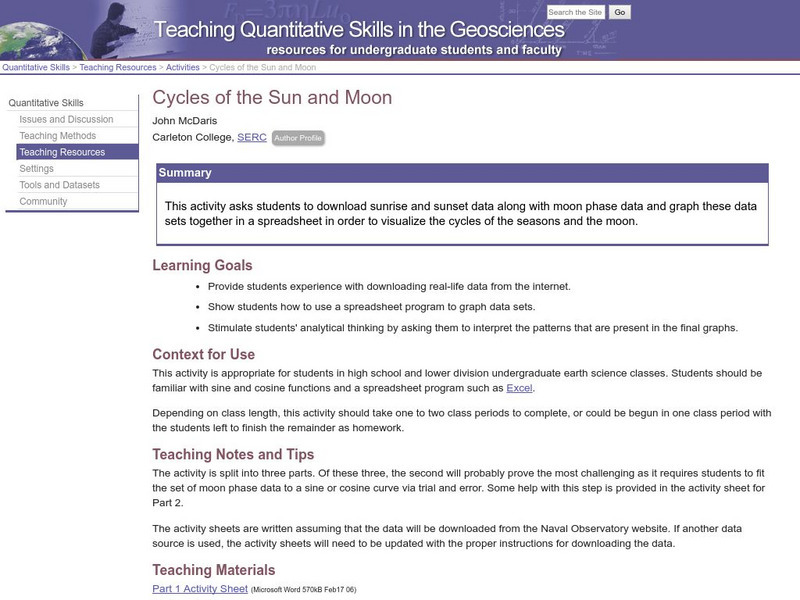
Serc: Cycles of the Sun and Moon
Students download sunrise and sunset data along with moon phase data, and graph these data sets together in a spreadsheet in order to visualize the cycles of the seasons and the moon.
ClassFlow
Class Flow: Parametric Equations and Further Graphing
[Free Registration/Login Required] Excellent diagrams, including the Ferris wheel, depict parametric equations and their related graphs.
Teachnology
Teachnology: Spreadsheet Guide for Teachers
A Spreadsheet is a wonderful tool with applications well beyond simple calculations. This site provides a collection of lesson plans, tutorials and worksheets that help bring spreadsheets into the classroom.
TeachEngineering
Teach Engineering: The Energy Problem
This six-day lesson provides students with an introduction to the importance of energy in their lives and the need to consider how and why we consume the energy we do. The lesson includes activities to engage students in general energy...
California State University
Cal State, San Bernadino: Hyperbolas
An excellent site describing the equations for hyperbolas, including graphs of hyperbolic functions and multiple exercises for practice.
Other
Water on the Web
Water on the Web (WOW) is an advanced site allowing students to actively participate in data analysis from real research sites. Lesson plans on a range of topics are provided. There is also a tutorial for using Excel to graph WOW data.
Teachnology
Teachnology: Survey Teaching Theme
Survey Theme provides an excellent collection of free sample worksheets, teacher resources, lesson plans and interactive media for grades k-12.
Teachnology
Teachnology: Survey Teaching Theme
Survey Theme provides an excellent collection of free sample worksheets, teacher resources, lesson plans and interactive media for grades k-12.
Interactive Mathematics
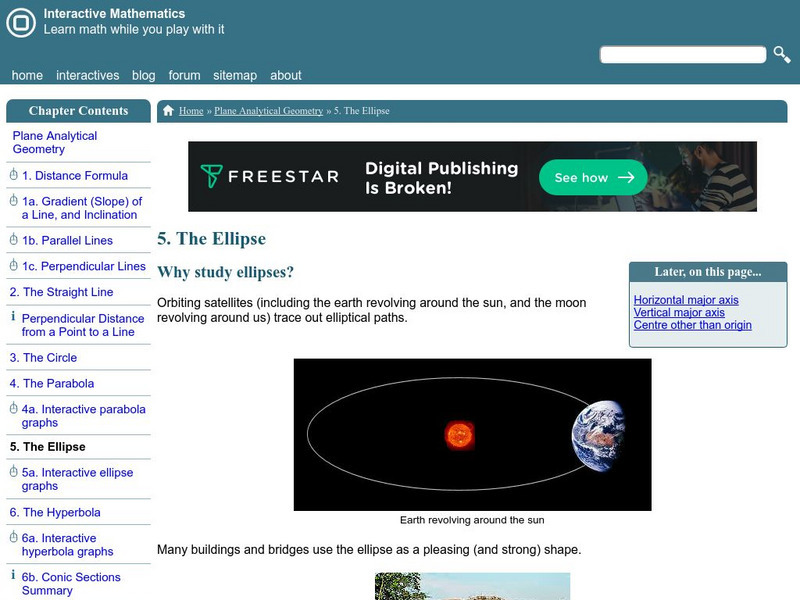
Interactive Mathematics: The Ellipse
This excellent lesson offers a thorough definition, description, and then step-by-step analysis of ellipses. Includes a focus upon the vertical and horizontal, major and minor axes, transllations of ellipses and more.
US Department of Education
Helping Your Child Learn Math: Math in the Home
An excellent compilation of activities that engage parents and children in math explorations at home. Detailed lessons covering a wide range of math topics such as fractions, measurements, money, data collection, and math in newspapers....
Other popular searches
- Circle Graph in Excel
- Excel Graphs and Charts
- Excel Graphs Eye Color
- Free Excel Graphs
- Excel Graphs M&m
- Creating Graphs in Excel
- Creating Excel Graphs
- Scatter Plot Graphs Excel
- Excel Graphs Mm
- Bi Excel Graphs
- Data Graphs on Microsoft Excel
- Making Graphs With Excel


