Hi, what do you want to do?
Earth Watch Institute
Entering Local Groundhog Data in an Excel Spreadsheet
Here is a cross-curricular ecology and technology lesson; your learners create spreadsheets depicting the location and number of groundhog dens in a local park. They research groundhogs and analyze data about where the groundhog...
Curated OER
Fast Food Survey Using Bar Graphs
Second graders create a bar graph to pictorically represent the data collected from a survey of students. They use Excel to electronically create the graphs and data tallies. They then interpret their data using sentences to explain.
Howard Hughes Medical Institute
Gorongosa: Scientific Inquiry and Data Analysis
How does the scientific process begin? Introduce ecology scholars to scientific inquiry through an insightful, data-driven lesson. Partners examine data from an ongoing research study to determine the questions it answers. The resource...
Curated OER
Earth Energy Budget Pre Lab
Young scholars explore energy by conducting an in class experiment. In this climate change instructional activity, students conduct a water vapor experiment in a soda bottle. Young scholars utilize graphs and charts to analyze the...
Teach Engineering
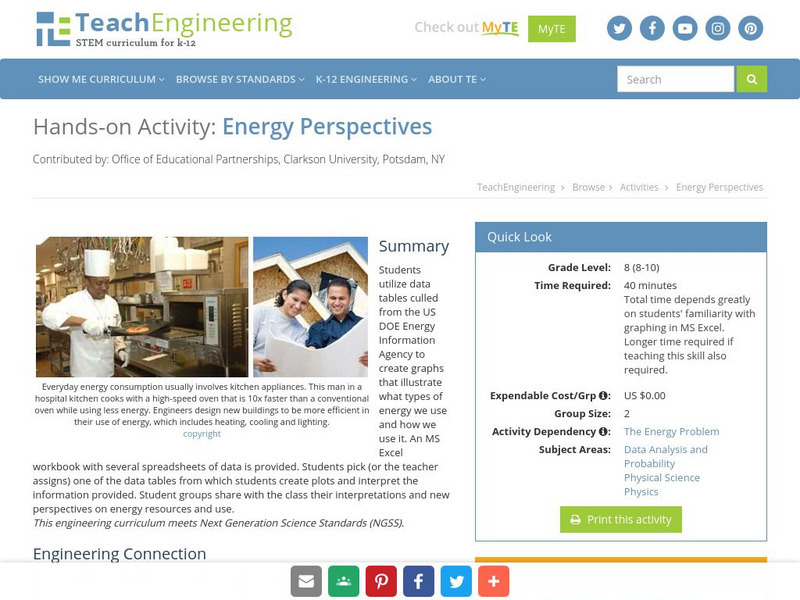
Energy Perspectives
The data says ... the resource is great to use. Using Microsoft Excel, pupils analyze data from the US Department of Energy in the fifth lesson of a 25-part Energy Systems and Solutions unit. Each group looks at a different data set and...
Curated OER
Creating Climographs
Learners use satellite data to compare precipitation and surface temperatures on different islands. In this satellite lesson students create graphs and explain the differences between weather and climate.
Curated OER
Dental Detectives
First graders explore the theme of dental health and hygeine. They make tooth loss predictions, count lost teeth, and graph tooth loss. In addition, they listen to dental health stories, read online stories, create spreadsheets, and play...
Curated OER
Dough Lake Topology
Young scholars practice coordinates and measurements, develop 2D, 3D topological map, construct grid with string on real surface, establish "level" fixed point for measurements, take and record data points of elevation, and enter data on...
Curated OER
Pumped Up Gas Prices
Students calculate gas prices. For this transportation lesson, students tally the mileage and gas costs of their car for one months. They figure out how much was spent on gas and create a graph showing average gas prices over time.
Curated OER
Significant Science: Statistics for Planet Earth
Ninth graders discover how statistics are used to interpret results of scientific experiments. Students write hypotheses and test the hypotheses by collecting data and organizing the data. Students graph their data to produce a visual....
Curated OER
What Do Plants Need to Grow?
Fourth graders control variables to determine the effect on plant growth. They collect information by observing and measuring and construct simple graphs, tables, maps and charts to organize, examine and evaluate information.
Curated OER
Plants Under Attack
Third graders will identify the four needs for plant survival and gain skills and confidence in using scientific measurement tools, probes as well as the spreadsheets and graphing capacity of a computer to represent and analyze data.They...
Curated OER
Lesson 14: Genetic Disorders
Young scholars create PowerPoint presentation on the topic they researched. In this biology lesson, students fill out a storyboard about their topic. They share their project in class.
Curated OER
DNA Technology
Pupils prepare PowerPoint presentation on DNA and cells. In this biology lesson, students create a storyboard of their presentation. They share the finished project in class.
Curated OER
Texas Weather Report
Students use provided links to observe selected weather sites and collect temperature and precipitation data for listed cities. They enter the information onto their spreadsheet. Students study maps of the Texas natural reagions,...
TeachEngineering
Teach Engineering: Energy Perspectives
Students utilize data tables culled from the US DOE Energy Information Agency to create graphs that illustrate what types of energy we use and how we use it. An MS Excel workbook with several spreadsheets of data is provided. Students...
University of Oregon
Magnet Lab: University of Oregon Virtual Laboratory
The collection of interactive physics applets offered by the University of Oregon is an excellent resource for students. The applets are grouped in broad subject areas including astrophysics, energy and environment, mechanics and...


