Radford University
A Change in the Weather
Explore the power of mathematics through this two-week statistics unit. Pupils learn about several climate-related issues and complete surveys that communicate their perceptions. They graph both univariate and bivariate data and use...
Kenan Fellows
Climate Change Impacts
Turn up the heat! Young mathematicians develop models to represent different climates and collect temperature data. They analyze the data with regression and residual applications. Using that information, they make conclusions about...
Curated OER
Flicking Football Fun
Young mathematicians fold and flick their way to a deeper understanding of statistics with a fun, hands-on math unit. Over the course of four lessons, students use paper footballs to generate data as they learn how to create line...
EngageNY
Estimating Probability Distributions Empirically 2
Develop probability distributions from simulations. Young mathematicians use simulations to collect data. They use the data to draw graphs of probability distributions for the random variable in question.
Curated OER
Calculating Theoretical & Experimental Probability
Students collect data by conducting a survey of fellow classmates. They investigate the relationship between estimates obtained from samples and theoretical probabilities. Answer keys included.
Curated OER
Populations and Life Cycles
Students explore biology by researching ocean statistics. For this data analysis lesson, students conduct a snail examination experiment utilizing live pouch snails. Students collect data about the snails over the course of six weeks and...
College Board
Coke® Versus Pepsi®: An Introductory Activity for Test of Significance
Most people claim they can tell the difference between Coke and Pepsi. Scholars conduct a fun experiment to test that claim! Once learners collect their data, they analyze the results and determine if the statistics are significant.
Radford University
Corn and Popcorn
Have a popping good time. Using probability and statistics skills, learners determine which type of popcorn to buy based on the percentage of kernels popped. After analyzing corn and popcorn sales to make a prediction of future sales,...
Curated OER
Photosynthesis
Learners recognize the importance of plants as they perform an experiment involving photosynthesis. Students determine the optimum wavelength of light for photosynthesis by exposing plants to different colors of light, collecting data,...
Curated OER
Seeing Is Believing
Students investigate the concepts of probability. They use data to find the central tendency, median, and mode. Students design and play a game in order to practice the concepts. They also complete a table with data that is analyzed.
Bowland
Crash Test
Use mathematics and simulations to investigate car crashes. IScholars test hypotheses involving car crashes. They collect, analyze, and display data from computer simulations to support or refute their hypotheses.
Curated OER
Analyzing Discrete and Continuous Data in a Spreadsheet
You are what you eat! Your statisticians keep a log of what they eat from anywhere between a day to more than a week, keeping track of a variety of nutritional information using a spreadsheet. After analyzing their own data, individuals...
Curated OER
Digital Statistics
Research data analysis by creating charts in class. Define the differences between an "average" and "range" while examining measurement data based on student height. Utilize computer software to create a height graph which is shared with...
EngageNY
Bean Counting
Why do I have to do bean counting if I'm not going to become an accountant? The 24th installment of a 35-part module has the class conducting experiments using beans to collect data. Learners use exponential functions to model this...
Teach Engineering
What a Drag!
Stop and drop what is in your hand! Pupils investigate how form effects drag in the 12th part of a 22-part unit on aviation. Groups create equally weighted objects and determine which one falls the fastest by collecting data.
American Statistical Association
A Sweet Task
Candy is always an effective motivator! A fun math activity uses M&M's and Skittles to explore two-way frequency tables and conditional probability. The candy can serve a dual purpose as manipulatives and experimental data.
Shodor Education Foundation
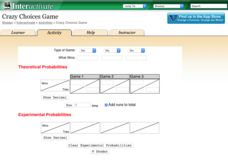
Crazy Choices Game
Wanna take a chance on which game is best? The resource provides three games of chance using multiple types of games. Games range from coin toss to cards. Choosing a type of game, pupils determine what wins and enter the theoretical...
Curated OER
Calculating Theoretical & Experimental Probability
Students explore the concept of experimental and theoretical probability. In this experimental and theoretical probability instructional activity, students collect data by conducting a survey of their classmates. Students compare their...
Curated OER
Take a Chance on Probability
Connect ratios, probability, and combination outcomes with a challenging activity idea. It guides your learners through probability of an event as fractions or ratios, on a number line, and with correct vocabulary. The class will be...
Curated OER
Probability and Expected Value
Students collect data and analyze it. In this statistics lesson, students make predictions using different outcomes of trials.
Curated OER
Handling Data: Coin Tossing Simulation
Learners collect experimental data and record it on a frequency table. After accessing an Internet coin toss simulation site they discover that repetition of an experiment may result in different outcomes. They identify the mutually...
Curated OER
Probability and Statistics
Students are taught to search the internet for statistics concepts on sports. In this probability lesson, students collect data and use the calculator to graph and analyze their data. They graph and make predictions about sports using...
Curated OER
Which Number Will Finish First?
Students conduct probability experiments. in this number lesson, students use spinners and conduct probability experiments. They collect and organize data on talley sheets.
Statistics Education Web
Consuming Cola
Caffeine affects your heart rate — or does it? Learners study experimental design while conducting their own experiment. They collect heart rate data after drinking a caffeinated beverage, create a box plot, and draw conclusions. They...


