Shodor Education Foundation
Scatter Plot
What is the relationship between two variables? Groups work together to gather data on arm spans and height. Using the interactive, learners plot the bivariate data, labeling the axes and the graph. The resource allows scholars to create...
Statistics Education Web
Consuming Cola
Caffeine affects your heart rate — or does it? Learners study experimental design while conducting their own experiment. They collect heart rate data after drinking a caffeinated beverage, create a box plot, and draw conclusions. They...
Howard Hughes Medical Institute
Scientific Inquiry Using WildCam Gorongosa
How do scientists determine what questions to ask to meet their research goals? Help your class develop an inquiry mindset with a lesson based on studies in the Gorongosa National Park. Partners create their own research questions by...
Shodor Education Foundation
Box Plot
What information can come from a box? Learners choose a data set to display as a box plot and decide whether to include the median in the calculation of the quartiles, show the outliers, and change the scale. To finish the lesson,...
Curated OER
Probability Experiment Simulation: Design and Data Analysis Using a Graphing Calculator
Seventh graders simulate probability experiments. Using a graphing calculator, 7th graders design, conduct, and draw conclusions from simulations or probability experiments. Students construct frequency tables and compare the...
Curated OER
Lessons for Atlatl Users with Some Experience-Grade 6
Sixth graders experiment with an atlatl and dart. In this sixth grade data management mathematics lesson, 6th graders explore and determine the most suitable methods of displaying data collected from their experimentation with throwing...
Curated OER
Data Management and Probability: Applications
In this data management and probability applications instructional activity, 7th graders solve 13 different types of problems that include finding the mean, median, mode, and range of each set of values, as well as, solving a number of...
American Statistical Association
More Confidence in Salaries in Petroleum Engineering
Making inferences isn't an exact science. Using data about salaries, learners investigate the accuracy of their inferences. Their analyses includes simulations and randomization tests as well as population means.
Curated OER
Data Analysis
Twelfth graders collect and analyze data. In this secondary end-of-course mathematics lesson, 12th graders formulate a question they would like to answer and decide on an appropriate means of data collection. Students present their...
Willow Tree
Histograms and Venn Diagrams
There are many different options for graphing data, which can be overwhelming even for experienced mathematcians. This time, the focus is on histograms and Venn diagrams that highlight the frequency of a range of data and overlap of...
CK-12 Foundation
Single Bar Graphs: Hockey Teams
Raise the bar for hockey fans. Using data about favorite hockey teams, pupils build a bar graph. They use the information from the graph to make comparisons and solve one- and two-step problems.
CK-12 Foundation
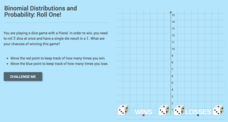
Binomial Distributions and Probability: Roll One!
It takes exactly one to win. Pupils calculate the probability of rolling five dice and having only a single die come up with a one. Learners calculate the number of expected wins out of a series of games. The interactive provides...
Curated OER
Learning to Make Line Graphs
Students analyze data and create a line graph. In this graphing lesson, students explore data from a previous experiment and plot the information on a line graph. Students analyze their findings.
Curated OER
Strict Parents
Are your parents or guardians strict? That's an interesting question many of your pupils are probably interested in discussing. How do you design a study directed at your high schooler to gain insight into that question? How do you...
Curated OER
Range, Mean, Median, Mode
Young scholars research the impact of craters. In this range, mean, median and mode lesson, students complete an experiment with a marble to simulate the effects of a crater. Young scholars collect and analyze data finding the range,...
Curated OER
Populations and Life Cycles
Students explore biology by researching ocean statistics. For this data analysis lesson, students conduct a snail examination experiment utilizing live pouch snails. Students collect data about the snails over the course of six weeks and...
Virginia Department of Education
Box-and-Whisker Plots
The teacher demonstrates how to use a graphing calculator to create box-and-whisker plots and identify critical points. Small groups then create their own plots and analyze them and finish by comparing different sets of data using box...
American Statistical Association
Bubble Trouble!
Which fluids make the best bubbles? Pupils experiment with multiple fluids to determine which allows for the largest bubbles before popping. They gather data, analyze it in multiple ways, and answer analysis questions proving they...
Statistics Education Web
Which Hand Rules?
Reaction rates vary between your dominant and nondominant hand ... or do they? Young scholars conduct an experiment collecting data to answer just that. After collecting data, they calculate the p-value to determine if the difference is...
Curated OER
Rescue Mission Game
Students conduct probability experiments. For this rescue mission lesson, sudents play a game and collect statistical data. They organize and interpret the data and determine the probability of success. Students plot points on a...
Radford University
A Change in the Weather
Explore the power of mathematics through this two-week statistics unit. Pupils learn about several climate-related issues and complete surveys that communicate their perceptions. They graph both univariate and bivariate data and use...
Shodor Education Foundation
Regression
How good is the fit? Using an interactive, classmates create a scatter plot of bivariate data and fit their own lines of best fit. The applet allows pupils to display the regression line along with the correlation coefficient. As a final...
Curated OER
Measurement and Paper Airplanes
Sixth graders investigate physics by creating paper airplanes. In this flight experiment lesson, 6th graders utilize stationary tools to create elaborate paper airplanes which they fly on their school grounds. Students complete...
Curated OER
Sets an the Venn Diagram
Students explore the characteristics of sets and Venn Diagrams. Given data, students practice determining the placement of elements in a Venn Diagram. Students discuss the correspondence between data sets and their graphical...


