Curated OER
What Functions do Two Graph Points Determine?
Your algebra learners write linear, exponential, and quadratic equations containing the same two graph points in this collaborative task.
Curated OER
Radioactive Decay Curve
Students gather and organize data. In this radioactive decay curve activity, students gather data as they follow the provided procedures for rolling dice. Students chart their data and examine interval results.
Curated OER
Introduction to Graphical Representation of Data Sets in Connection with Nuclear Decay
Students record data, make observations, and share in experimentation and discussion of numerical experiments.
Curated OER
Buying Cars/Financing Cars Compound Interest
Provide a real world context in which exponential functions are used to determine a eal world phenomena such as compound interest and exponential growth. This instructional activity should be taught after students have mastered the laws...
Curated OER
Will Exams Be Cancelled?
If the flu outbreak continues, exams will have to be canceled. Investigate the properties of exponential and logarithmic functions. In this algebra lesson, students use the TI to examine and differentiate between exponential growth and...
Curated OER
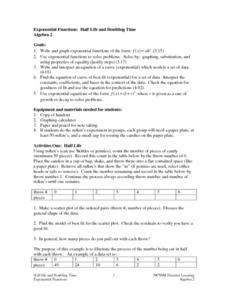
Exponential Functions: Half Life and Doubling Time
Students investigate the concept of exponential functions and how they increase in size over time. They simplify the functions in order to find the solutions that are possible and perform analysis of the curved line that is produced when...
Curated OER
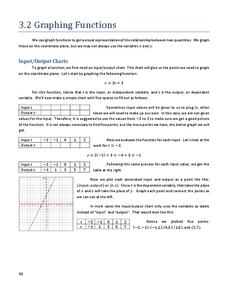
Graphing Functions
For this graphing functions worksheet, students write functions in logarithmic and exponential forms. They evaluate logarithms and determine the inverse of a function. Students graph functions. This six-page worksheet...
Curated OER
Endocrine Disruptors in Our Drinking Water: Should We Be Concerned?
Students investigate the different hormone contaminants in the water supply. In this math instructional activity, students analyze data tables and graphs. They demonstrate exponential growth and decay using frog populations.
Curated OER
Get a Half-life!
Pupils explore decay functions and the half-life of a substance. Through an M&M activity with calculators, students collect and graph data. They determine the linear, quadratic and exponential functions of the graph. Pupils...
Curated OER
Introduction to Graphical Representation of Data Sets in Connection to Cellular Growth
Students practice graphing relationships between variables by studying topics such as exponential growth and decay. They conduct a series of numerical experiments using a computer model and a variety of physical experiments using mold,...
Mathematics Vision Project
Module 3: Polynomial Functions
An informative module highlights eight polynomial concepts. Learners work with polynomial functions, expressions, and equations through graphing, simplifying, and solving.
Curated OER
Get a Half-life!
Students use m&m candies as their sample set. They begin by counting the total number of candies to determine their sample size. Students put the candies into a cup and shake them gently before pouring them onto a paper plate. Count...
Curated OER
An Introduction to the Natural Logarithm (ln)
Students explore the dose response principle, an introduction to what the "natural log" (ln) is and how it behaves. They create and analyze a dose response graph.
Curated OER
Reciprocals of Quadratic Functions
Eleventh graders investigate inverse functions. For this Algebra II lesson, 11th graders use their prior knowledge of linear, exponential,and quadratic functions to create a graph of an equation they have never seen before.
Texas Instruments
Texas Instruments: Numb3 Rs: A Matter of Half Life and Death
Based off of the hit television show NUMB3RS, this lesson introduces students to the topic of exponential decay and half-life. The lesson is built around Cesium-137, a radioactive isotope, and it's declining radioactivity over the course...
Illustrative Mathematics
Illustrative Mathematics: F Le Basketball Rebounds
The purpose of this task is to introduce learners to an exponential decay function in the form f(x) = abx, with a concrete interpretation of the decay factor b. A table shows the rebound height of a basketball for each successive bounce....
Khan Academy
Khan Academy: Algebra I: Exponential Functions From Tables & Graphs
Write exponential functions of the basic form f(x)=a * b squared, either when given a table with two input-output pairs, or when given the graph of the function. Students receive immediate feedback and have the opportunity to try...
Khan Academy
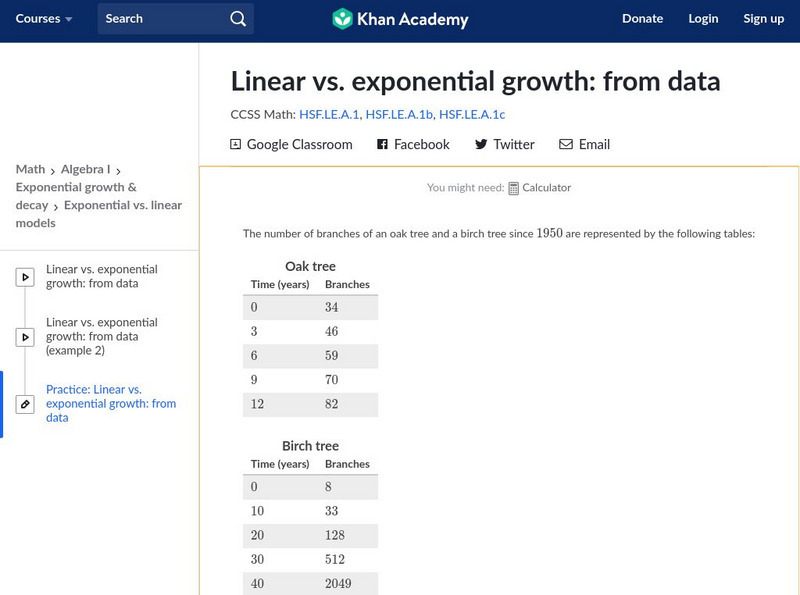
Khan Academy: Algebra I: Linear vs. Exponential Growth: From Data
Given a table with values of two quantities over time, determine whether the quantities grow linearly or exponentially. Students receive immediate feedback and have the opportunity to try questions repeatedly, watch a video or receive...
Illustrative Mathematics
Illustrative Mathematics: F Le Us Population 1790 1860
In this task, students are shown a table of U.S. population data between 1790 and 1860 and are asked to explore whether exponential functions would be appropriate to model relationships within the data. The purpose of the task is to help...


