Curated OER
Graphing Using Excel
Fifth graders complete a series of graphs by gathering information and using Excel to graph the information. In this graphing lesson, 5th graders graph favorite desserts of the class. Student put their results into the computer and then...
Curated OER
Tally Marks
In this mathematical worksheet, students practice mastering the concept of keeping up with tally marks in a variety of activities. Students complete a survey involving tally marks.
Curated OER
Trumpet of the Swan
In this literature worksheet, students, after reading the book Trumpet of the Swan, survey their friends to find out who was their favorite character from the novel. Students keep a tally sheet with their findings on it.
Curated OER
Off the Hook Books
Students complete a survey that gives their teacher an idea of their reading habits and favorite books. The teacher will use the survey in order to build a classroom library that appeals to all students.
Curated OER
Favorite Food Graph (Blank)
In this math instructional activity, learners create a bar graph to display the results of "your Favorite Food Survey." The graph is not labeled but has spaces for all the choices.
Curated OER
Color Survey
In this mathematical learning exercise, students survey twenty people to find out what their favorite color is and then graph out their findings.
Curated OER
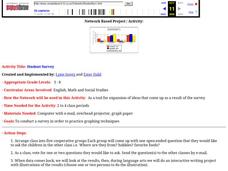
Student Survey
Students create questions they would like to ask another class of Students, send the questions by email, examine results, and create slideshow illustrating results.
Curated OER
Trumpet of the Swan Favorite Character Graph
In this math and literature worksheet, students survey classmates about their favorite character in the book Trumpet of the Swan. Students display the data on this blank bar graph.
North Carolina State University
Exploring Genetics Across the Middle School Science and Math Curricula
Where is a geneticist's favorite place to swim? A gene pool. Young geneticists complete hands-on activities, experiments, and real-world problem solving throughout the unit. With extra focus on dominant and recessive genes, Punnett...
Curated OER
How Do You Like To Eat Your Apples?-- Class Bar Graph
In this math instructional activity, students collaborate as a group to plot data pertaining to their favorite ways to eat apples: sliced, pie, whole, sauce, caramel or muffin. Students record their class data on the bar graph.
Curated OER
"Favorite Fairy Tale Characters"
Third graders enter the results of their survey on a spreadsheet. They construct a bar graph showing the results.
Curated OER
It's Time to Wrap-Up the School Year!
As the school year rapidly comes to a close, don’t forget to collect feedback to improve your teaching.
Virginia Department of Education
Weather Patterns and Seasonal Changes
Get your class outside to observe their surroundings with a lesson highlighting weather patterns and seasonal changes. First, learners take a weather walk to survey how the weather affects animals, people, plants, and trees during...
Curated OER
El Salvador: Whose Breakfast Isn't for the Birds?
Sixth graders investigate the understanding of where coffee is grown by conducting a survey. They study the natural history of coffee and examine bird habitats in the areas where coffee is grown. They write letters to explaining the...
ESL Kid Stuff
Intro ESL Lesson (Ages 8-14)
Introduce language learners to class behavior expectations, and each other, with activities that include greeting and name games, conducting a class survey, and creating a classroom rules poster.
Curated OER
What is the Best Chip?
Scholars collect data about chips. They pick their favorite type of chip from a given variety such as potato chips, tortilla, or banana chips. Then they write on an index card their favorite chip and why it's their favorite. They also...
Curated OER
Animals of the Arctic
Sixth graders research an Arctic animal. They survey the questions in the Animal Report in order to conduct their research. They investigate their chosen animal by using the Internet, library books and reference books.
Curated OER
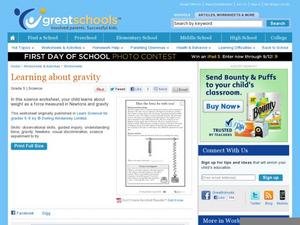
Learning about gravity
Learn how to measure weight with newtons in a science experiment about gravity. After they read a short paragraph about force, fifth graders draw an arrow to indicate which way a spring is being pulled. Next, they survey their family...
Virginia Department of Education
May I Have Fries with That?
Not all pie graphs are about pies. The class conducts a survey on favorite fast food categories in a lesson plan on data representation. Pupils use the results to create a circle graph.
Curated OER
How does Physical activity Help You?
Examine factors that influence your choice about physical activity. In this physical activity lesson, students recognize how physical activity and good health go together. Students participate in a survey about physical activity and...
Curated OER
Collecting Data to Learn About the People Around You
Human graphs, anyone? Did you eat fruit today? What is your favorite costume? Have your K – 6 learners graph the responses. Early elementary grades may count and compare while upper grades compare responses of different groups or make...
Curated OER
Graphs that Represent Data Sets
These four scenarios all contain graphable data; can scholars match them to the correct bar graphs? All the data is in single-digit whole numbers. Some of the scenarios instruct kids to make a graph, while others don't. Clarify...
Math Worksheets Land
Pie or Circle Graphs—Step-by-Step Lesson
How do you display data that you've collected in a pie chart? Follow a clear step-by-step guide to turning survey results into a visible format. It shows kids how to determine the percentage of the whole that each section represents.
PBS
Reading Adventure Pack: Animals
Scholars explore the animal kingdom with help from two texts, Blueberries for Sal by Robert McCloskey and A Bed for the Winter by Karen Wallace. The literature and informational text set the learning stage for thoughtful discussion and...


