Curated OER
Gold Rush California and its Diverse Population
Young scholars compare contemporary cultural differences with historical differences based on population percentage. For this cross-curriculum Gold Rush/math lesson, students analyze aspects of California's Gold Rush population and...
Curated OER
The Stock Market
Pupils explore the loss and gain made in the stock market as they invest a sum of money and report the results as percentages instead of points.
Curated OER
Book: Latinos Today: Facts and Figures
Students, after reading Chapter 1 in the book, "Latinos Today: Facts and Figures," identify and characterize the four main ethnic/racial groups in America. They calculate and design a bar graph showing their populations by their...
Curated OER
The World in a Classroom
Students calculate percentages of different kinds of people in the world. For this diversity lesson plan, students will see the percentages of different people and different incomes based on if the world only had 100 people in it.
Curated OER
Fractions: Jewish Population of Europe during WWII
Students evaluate population maps and convert fractions to percentages. In this WWII lesson, students use statistics on the Holocaust to determine population loss and change. Students create their own math questions and answers using the...
Education World
The African American Population in US History
How has the African American population changed over the years? Learners use charts, statistical data, and maps to see how populations in African American communities have changed since the 1860s. Activity modifications are included to...
Curated OER
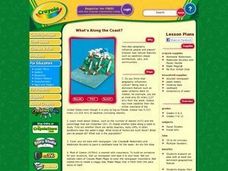
What's Along the Coast?
Students research an area with at least one dominant geographical feature. Then they display their findings in a realistic 3-dimensional presentation. Students also prepare ancillary material to support their project. Finally, they chart...
Curated OER
A Statistical Look at Jewish History
Students complete their examination over the Jewish Diaspora. Using population figures, they discover the importance of percentages in exploring trends. They use their own ethnic group and determine how it is represented in the United...
Curated OER
Historical Indian Treaties and Aboriginal Population
Sixth graders navigate an online atlas of Canada and compare the land area of of historical Aboriginal peoples in Manitoba to present-day figures.
Curated OER
The Car Pool is Coming
Learners evaluate the number of people who travel out of their town to work. They figure out what the percentage of each town's commuting workers is to the number who commute in the region. They plot the percentages on a pie chart.
Curated OER
After Christmas Specials
In this math worksheet, students solve 4 story problems which pertain to after-Christmas shopping. Students will calculate prices of items on sale, figure out the best deals and solve percentage-off problems.
Curated OER
The Microwave and the Jiffy Store
Young historians examine the lifestyle changes and cultural changes that occurred as a result of the challenges posed by World War II on society in general. With regard to American History and culture, pupils write an essay on the...
Curated OER
From There To Here...
Students find out where some of the products in hour homes come from, then become aware of our local trash, landfills and incinerators. They chart and graph data and use maps for different purposes.
Curated OER
Colonial Society on the Eve of Revolution 1700-1775
Six slides show maps, graphs, and trade routes showing the demographics and economy of the early colonial economy. No text is included in this presentation, it is for supplemental use only.
Curated OER
New Movements For Social Justice: The Latino Struggle for Equal Rights
Students examine myths and stereotypes about Hispanic immigrant groups. They appreciate and share the strengths of their diversity and view films that challenge ideas about education and cultural values. They explore the Latino Rights...
Curated OER
The Importance of Trees in the Rural Area: Planting a Snowfence
Students explore the concept of living snowfences. In this tree instructional activity, students read, "The Living Tree," brochure and discuss the ecological benefits of planting trees to create living snowfences. Students draw plans for...
Curated OER
The Taxpayer's Rights
Young scholars examine rights of taxpayers and procedures the IRS uses to process tax returns
Curated OER
Election 2005: Campaign Issues
Students take a closer look at the election of 2005. In this British politics lesson, students listen to a lecture about the 2005 campaign and active citizenship. Students then create collages and news boards about the...
Curated OER
State Assisted Capitalism
Middle schoolers discuss a the places to gain financial help when starting a business. With a partner, they calculate the amount of interest and the total amount being paid back. they brainstorm a list of things the government can do...
Curated OER
Utah's Tax Situation
Students examine Utah's tax burden as relative to other states, explore types of taxes levied in Utah, including property, personal income, and sales taxes, define tax-related vocabulary, and conduct research to complete critical...
Curated OER
Migration and Refugees
Learners explore issues relating to refugees. Using the internet, they gather facts about refugees. Students discuss the range of situations which turn citizens of one country into refugees of another.
Curated OER
State Report - HyperStudio
Students create a HyperStudio stack and use an LCD projector to share a state report with their class. Eighth grade students collaborate with fourth grade students to create the presentation.
Curated OER
Voter Turnout
Students solve problems using math. They complete a graph, using data from the 2000 presidential election results. Students predict and calculate the outcome of the election based upon the voting patterns.
Curated OER
Meatiest States: Graph Problem Solving
In this graph problem solving worksheet, learners analyze a graph that shows commercial red meat production in five states. Students answer 5 word problems using the data on the graph.


