Curated OER
Vocabulary Charts
Help your kids learn their vocabulary with a lesson plan and graphic organizer. After receiving a list of new vocabulary words, learners look up the definitions in dictionaries and fill in the worksheet. Additionally, they include a...
Smithsonian Institution
A Ticket to Philly—In 1769: Thinking about Cities, Then and Now
While cities had only a small fraction of the population in colonial America, they played a significant role in pre-revolutionary years, and this was certainly true for the largest city in the North American colonies: Philadelphia. Your...
Curated OER
High Tech Food
Students view videos, read, and fill in charts about agriculture production. In this agriculture lesson plan, students complete these agriculture activities and explore careers in agriculture.
Curated OER
Weather Instrument Data Chart 2
In this science worksheet, students look for the data that is needed to fill in the graphic organizer. The prefixes are given that are needed to sort the information as it is collected.
Curated OER
Gases In The Atmosphere
In this science worksheet, students look for the amounts of air composition in the atmosphere by filling in the three different data charts.
Curated OER
Reading Immigration Graphs and Charts
Students examine the settlement patterns and land use in Minnesota. In groups, they practice reading immigration graphs and charts and discuss why immigrants settled where they did. They are also introduced to new vocabulary related to...
World Wildlife Fund
Land of the Midnight Sun
From days of 24 hour sunlight, to endless nights that last for days, the Arctic is a very unique place to live. Examine the seasonal changes that occur in the northern-most reaches of the globe and the impact they have on the plants and...
iCivics
A Trip Around the World
How do the rights of citizens in other countries, such as India, Germany, Brazil, and Iran, compare to those of Americans? Take a closer look at the provisions of various foreign constitutions, and compare and contrast the protections...
Curated OER
Subtracting Integers
For this subtracting integers worksheet, students complete problems and fill in charts that require them to subtract integers. Students complete 8 problems.
Neufeld Learning Systems
Concept: Ratios and Proportions
Upper elementary and middle school pupils fill out a chart creating six equivalent fractions and then compare them to six different objects and/or shapes. They group together 16 various terms related to ratios and proportions. Pupils...
ARKive
Handling Data: African Animal Maths
Handling and processing data is a big part of what real scientists do. Provide a way for your learners to explore graphs and data related to the animals that live on the African savannah. They begin their analysis by discussing what they...
Curated OER
On the Road Again
Students work with patterns to develop formulas that will help them determine total cost. In this patterning activity, students watch a video about an NBA trainer. (not included) They work in groups to access the assigned Internet...
Curated OER
Teaching fractions & ratios with M&Ms
Students collect data using M&Ms, fill in charts, and write ratios and fractions for each color M&M.
Curated OER
Making Cookies- How many per hour?
Fifth graders measure how long it takes to make cookies. In this measuring time lesson, 5th graders explore how to manage time. Students decide when to start making breakfast on time, how to calculate playing time into their lunch time,...
Curated OER
Meter Reading Using Place Value
Fourth graders watch a video about reading a gas meter and discuss what they saw in the clip. For this place value lesson, 4th graders complete a worksheet where they fill in the missing dials on the meters.
Curated OER
The Meaning of Whole Numbers
In this whole numbers worksheet, students fill in different charts asking about the place value of various whole numbers. Students complete 8 problems.
Curated OER
Percent of a Number
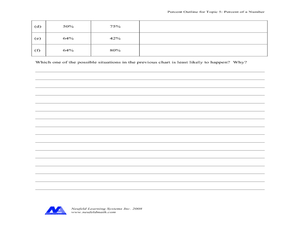
In this percent worksheet, students complete problems such as changing percents to decimals, filling in percentage charts, and more. Students complete 8 problems.
Curated OER
Building Vocabulary Quadrant Charts
This clever language arts lesson invites pupils to read verses of poetry, then construct vocabulary quadrants on index cards. The cards are divided up into 4 sections: Word, Meaning, Opposite, Example. They choose a difficult word from...
Curated OER
Identifying and Using Parts of Speech in Writing: Technology, Word Processing
Students identify and suggest suitable parts of speech to fill in the blanks in a prepared text (the text can easily be tailored to language ability and desired subject). They use word processing to edit the text.
Curated OER
Bird and Breakfast
Students examine winter birds. In this KWL chart lesson plan, students fill out the chart and view a PowerPoint presentation. Students then complete the chart and discuss winter birds.
Curated OER
Where In the World Are You?
Fourth graders fill in blank copies of the United States Map and then the World Map.
MENSA Education & Research Foundation
Probably Probability
Reinforce the concept of probability with a series of lessons highlighting the idea of likelihood, probability formulas, relative frequency, outcomes, and event predictions. The collection is made up of four lessons offering informative...
Curated OER
Build Mastery: Main Idea
Use a graphic organizer to get readers thinking about main ideas as they record the who, what, where, when, and why of a story. Consider modeling this process completely before kids do this independently. They fill in five boxes charting...
West Contra Costa Unified School District
Comparing Rational Functions and Simplified Functions
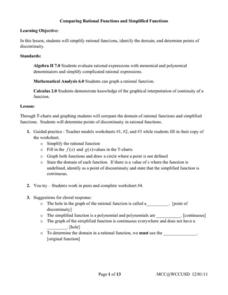
What kind of functions have holes in their graphs? Here, the teacher guides the class on how to use the simplified function of a rational function to aid in the graphing of the original rational function. T-tables are used in order...


