Curated OER
Star it Chart
In this main idea worksheet, students fill out a star graphic organizer about the main idea, movement, location, place, and more for a subject. Students complete 6 spaces.
Curated OER
The Needs of Living Things
Students investigate the global food chain by creating a visual chart. In this ecology lesson plan, students discover the elements needed for life to sustain itself, contrasting living things vs. non living things. Students...
Curated OER
Rolling For Value
Students participate in a activity to comprehend the concept of probability while rolling dice. They recognize patterns while making observations and recording the data for each roll. Students also review place values while playing a...
Curated OER
Addition Squares #2
In this addition square worksheet, students fill in the squares so the sums are correct on the right side and at the bottom. Students complete 5 squares.
Curated OER
Multiply and Divide by 10
In this multiplication and division instructional activity, students fill in the chart by multiplying by the number 10 and dividing by the number 10. They then describe the pattern they are seeing. There are 2 charts to fill out.
Curated OER
Applications and Interviews
Students practice completing applications for jobs. They examine the do's and dont's of filling out an application. They also participate in a mock interview process.
Curated OER
Trade Is A Complex Chain of Events
Students research the steps that are involved to bring a product to market for consumers. They answer questions and fill in a chart related to their product. They also use maps to show the geographic distribution of their product.
Curated OER
Tell Time With Your Feet
Pupils discover what the latitude and longitude of their location is. They start walking and measure their shadow. They fill in a chart to discover the approximate time.
Curated OER
How Many Ways?
In this math puzzle worksheet, students are given 10 buttons on the page, and they are to arrange the buttons in the 3 boxes provided. Students fill in the chart to find out how many ways they can put the buttons in the boxes.
Curated OER
Tener
What does tener mean? Introduce your Spanish novices to this important verb. First, they fill out the conjugation chart. Next, they read the examples and explanation as a whole class. There's a short practice activity at the end to...
Council for Economic Education
You Can BANK on This! (Part 2)
This is part two in a four-part instructional activity on banking and personal finance. In this instructional activity, learners analyze whether or not they have made a good purchase, then discuss how to make an informed decision about a...
Safe Drinking Water Foundation
Demonstration of Water Pollution
In this teacher-led demonstration, your young environmentalists will observe and record how different types of water pollutants look when they are combined. From here, individuals will develop a hypothesis on how the water can be...
Curated OER
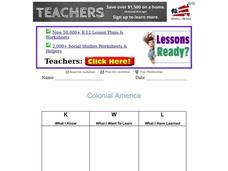
Colonial America
In this KWL chart worksheet, students explore colonial America. Students fill out the three columns, what I know, what I want to learn, and what I have learned as they study colonial America.
Curated OER
KWLH
In this graphic organizer worksheet, students fill out a KWLH chart about a topic of their choosing. Students write what they know, want to know, learned, and how they can learn more.
Curated OER
Identifying Compare and Contrast Key Words
Students read the passage titled Moving to a New Town and circle key words that show compare and contrast. In this compare and contrast lesson plan, students also fill out similarities and differences in a T chart.
Environmental Protection Agency (EPA)
How Much Water Do You Use?
Incorporate reading strategies, math, research, and the scientific method into one instructional activity about water conservation. After reading a story about a landlady trying to determine how many people are living in an apartment,...
Curated OER
Class Birthday Graph
Young scholars analyze the basics of an Excel spreadsheet. They highlight cells in a spreadsheet. They make a column graph. Students are introduced to X-axis and Y-axis. They play various address games on the spreadsheet.
Curated OER
Tension Between Conflict and Compromise
Learners prepare for and participate in a debate and mock trial regarding laws broken during the Boston Tea Party. Several primary documents and a homework chart are included.
Council for Economic Education
Satisfaction Please! (Part 3)
Understanding the US government's role proves very important in the American economy, especially for consumers. Scholars learn about how varying government agencies help them when facing an issue. The third and final resource in the...
Curated OER
Read to Learn
Students explore the concept of community helpers. In this community helper lesson, students brainstorm the community helpers in their neighborhood after reading a book about jobs in the community. Students then host a...
Little Book Lane
"Ch" Words
What do chug and chain have in common? The consonant digraph ch of course. Hold onto your hats – here is a packet of worksheets with enough practice activities to fill a short unit. It contains two lists of ch words, three practice...
Curated OER
The Five W's
In this graphic organizer worksheet, students answer the five w's in the provided spaces on the worksheet. There are five spaces on the worksheet to fill out. This is ideal to use as a reading comprehension tool.
Curated OER
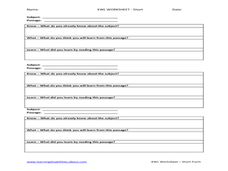
KWL Worksheet-Short Version
In this KWL worksheet, students complete a graphic organizer, filling it what they already know about a subject, what they think they will learn and what they did learn. Chart is printed 3 per page for copying purposes.
Curated OER
Give a Mouse a Cookie
Students listen to the book, If You Give a Mouse a Cookie. As they listen to the story, they fill in a progression chart. Then students write and illustrate their own story to share with the class.
Other popular searches
- Fill in Angle Charts
- Fill in Percentage Charts
- Fill in Charts
- Fill in the Integer Charts
- Heart Fill in Charts


