Illustrative Mathematics
Chicken and Steak, Variation 2
Many organizations put on barbecues in order to make money. In a real-world math problem, the money allotted to purchase steak and chicken at this barbecue is only one hundred dollars. It is up to your potential chefs to figure out how...
Curated OER
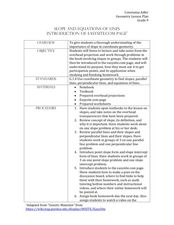
Slope and Equations of Lines
In this slope worksheet, students find the equation of a line given a pair of points or a given slope. Examples are provided at the beginning of this worksheet. There are 20 problems on this two-page worksheet.
Curated OER
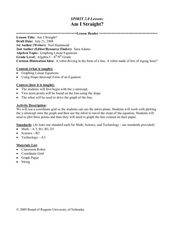
Am I Straight
Identify the slope of a linear equation in this algebra lesson. Middle schoolers graph linear equations using slopes and intercepts. They identify the slope as being positive, negative, no slope, or undefined.
Curated OER
Using Factoring to Solve Equations
Eleventh graders use factoring to solve 44 different problems involving area, intercepts, quadratic equations, and functions.
Curated OER
Parallel Lines and Properties of Slope
Students define functions to be graphed using the Y=key. They demonstrate how to set up a standard viewing screen using Zoom 6. They discuss and explore mathematical questions on a worksheet.
Curated OER
Function and Graphs
In this college level Pre-Calculus worksheet, students determine if a given relation is a function, graph functions and observe their behavior, and determine if a function is even, odd, both, or neither. The four page worksheet contains...
Curated OER
Graphing Linear Equations
Ninth graders review the information that they have already learned
with regard to linear equations and graphical representations. They then assist in combining equations with a graphical element and complete various graphs with this...
Curated OER
Graph Logarithms
Mathematicians graph logarithmic equations. Teach your students how to identify the intercepts of logarithmic equations and tell whether the function is increasing or decreasing. They find the domain and range of each function.
Curated OER
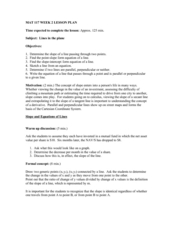
Lines in the Plane
Young scholars differentiate between parallel and perpendicular lines. In this algebra lesson, students graph linear equations using the slope intercept form. They classify lines based on their slopes.
Curated OER
Forms of Equations
Ninth graders discuss the different forms of equations. In this algebra lesson, 9th graders talk about the pros and cons of algebraic equations. They discuss reflection across the x and y axis and write out the equation of the given...
Curated OER
Exploring the Exponential Function
Learners collect and analyze data regarding exponential functions of the form y = abx. Young scholars explore the affects of changing parameters on the graph of the function.
Curated OER
Lines of Fit
Students analyze graphs. In this algebra lesson, students find the line of best fit, using scatter plots. They calculate the sale of popcorn as it relates to the price. They then analyze the graphs for positive, negative and no correlation.
Curated OER
An Exploration of the Slope of a Line
Students define the slope of a line. In this algebra lesson plan, students differentiate between parallel and perpendicular lines using their slopes. They rewrite equations in slope intercept form and explain the meaning of the slope.
Curated OER
Linear and Exponential Models
Students investigate the differences between linear and exponential models. In this linear and exponential models lesson, students make a table of given data. Students determine if the data is linear or exponential by plotting the data...
Curated OER
The Standard Form of A Quadratic Equation
Students investigate equations that are in the standard form of a quadratic equation represented as Y=ax2+bx+c. They factor the equations into linear factors to determine the x intercepts. The graph is also used to determine the x...
Curated OER
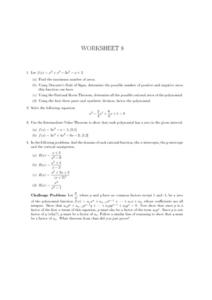
Worksheet 8, Exponents
In this calculus worksheet, students analyze one equation by finding the maximum number of zeros. They use Descarte's Rule of Signs and the rational roots theorem. Students use synthetic division to factor the polynomial. Students solve...
Curated OER
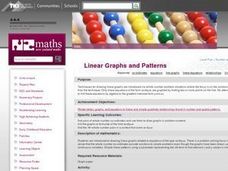
Linear Graphs and Patterns
Fifth graders find pairs of whole number co-ordinates and use them to draw graphs in problem contexts. They find and interpret the all meaningful pairs of whole number co-ordinates from graphs.
Curated OER
Quadratic Function Graph
Learnerss engage in a study of quadratic functions and how the coefficient of x^2 has on the graph of it. They study the quadratic function for review with the help of index cards. The lesson includes a resource link to align the it with...
Curated OER
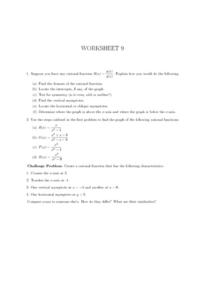
Worksheet 9, Rational Functions
In this algebra worksheet, students tell how they would find the domain of a rational function. They find the intercepts of a rational function and graph it. Students test for symmetry, locate the asymptotes and determine where the graph...
Curated OER
Slope of a Function
Seventh graders explore the concept of the slope of a line. They see how to determine the direction of the line. Also students are introduced to the slope intercept algebraic expression in conjunction with the rise/run.
Curated OER
Identifying slope from Equations
Learners find the slope of a line given a linear equation in slope-intercept form. They also find the slope of a line given a linear equation in standard form. Students finally graph the line to show it visually.
Curated OER
Composition of Functions
Students solve problems using the composition of functions. In this algebra instructional activity, students analyze the graph of a quadratic equation for its vertex and intercepts. they find the inverse of the function using addition,...
Curated OER
Worksheet 7, Polynomials
In this algebra worksheet, young scholars graph 3 polynomial functions. They find the intercepts, and the intervals above the x axis. Students create their own polynomials with given characteristics.
Curated OER
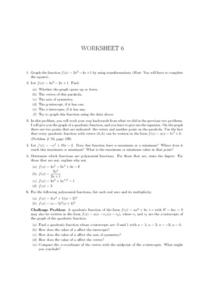
Worksheet 6, Graphing Functions
In this algebra worksheet students graph a given function by completing the square. They analyze a function and tell the axis of symmetry, the intercepts, and vertex. Students identify the maximum or minimum of a graph. Students identify...


