Curated OER
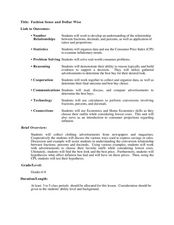
Fashion Sense and Dollar Wise
Middle schoolers find the cost of an outfit. In this percentages lesson, students look at ads, pick out an outfit, and find the sale price. They create a commercial and complete 4 included worksheets.
Curated OER
Calculating Baseball Statistics
Students calculate baseball statistics. In this data analysis lesson, students use baseball statistics to calculate the batting average and slugging percentage. Students visit www.funbrain.com to play a math baseball game.
Curated OER
Paying for Crime
Students participate in activties examining ratios and proportions. They use graphs to interpret data showing the government's budget for prisons. They present what they have learned to the class.
Curated OER
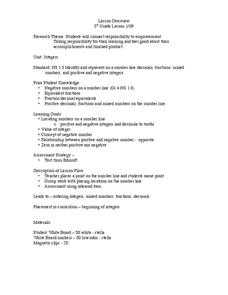
Integers
Using a simple technique, learners practice identifying integers on a number line. As numbers, both positive and negative, are pointed to, they name them. This could be part of anticipatory set before a instructional activity on integers.
Curated OER
How Fast Is Your Car?
Eighth graders discover the relationship between speed, distance, and time. They calculate speed and represent their data graphically. They, in groups, design a ramp for their matchbox car. The goal is to see who's ramp produces the...
Curated OER
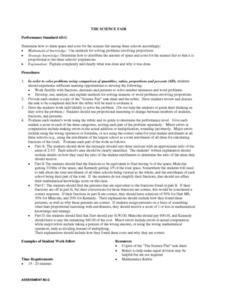
Science Fair Space
Students determine the most equitable way to share space and cost between three schools for a fictional science fair. Given a diagram, a word problem, and a data set, students analyze and explain the best way for all schools to share...
Curated OER
Piece of the Sky: Introduction for Making S'COOL Observations
Young scholars observe and discuss cloud cover. They identify percent of cloud cover, calculate cloud cover by fraction and convert to a percent, and compare their models with the current real sky cloud cover.
Curated OER
"Water is Life" Global Water Awareness
Young scholars examine and calculate the percentage of potable water remaining on the earth. In this ecology and geography lesson, students brainstorm the main factors affecting water distribution. Young scholars use mathematical problem...
Curated OER
Graphing
Students collect data to create different types of graphs-line, pie, and bar graphs. They use StarOffice 6.0 to create graphs.
Curated OER
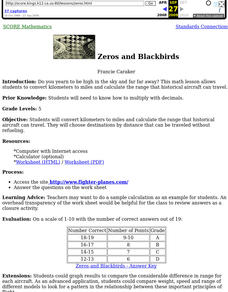
Zeros and Blackbirds
Fifth graders convert kilometers to miles and calculate the range that historical aircraft can travel. They choose destinations by distance that can be traveled without refueling.
Curated OER
Cannot Buy Me Love
Young scholars investigate the concepts that are related to finance and how it is used in the world. They take part in activities that are focused around the use of a spreadsheet while using a T-chart to simulate a ledger of credits and...
Curated OER
Company is Coming
Students find a recipe for pancakes on the web then figure out how to half the recipe then figure how to make 3/4 of the pancakes.
Curated OER
Squirt
Fourth graders using the idea of "how many more squirts" fill a container to develop multiplicative thinking. They also investigate the idea of conservation of volume when working with oddly shaped containers. They attempt to use...
Curated OER
Create A Question
Students explore mathematical problem solving. Given a case problem, students write a rule to solve problems involving decimal multiplication and division. They invent problems, share them with the class, and solve other student's...
Curated OER
Making Change
Second graders explore how to incorporate a new type of technology, the cash register and/or a calculator, as a motivational tool for solving real life problems. They practice estimating money and counting back change from $20.00.
Curated OER
Numbers Beyond Reason!
Fourth graders use the story of the discovery of irrational numbers to explore the different classes of numbers, the different ways in which numbers may be represented, and how to classify different numbers into their particular class.
Curated OER
Hollywood's Top Ten
Students gather data on top 10 highest grossing movies, and make a bar graph and a pictogram.
Curated OER
Projectile Motion
Learners observe projectile motion and calculate the speed of a baseball based on the time and distance traveled. They record the time, measure the distance, and draw the path of the ball's travel on a data table.
Curated OER
Barge Building: What Floats Your Boat?
Students construct aluminum foil boats that float while holding the greatest number of pennies. They investigate the concept of water displacement, record their results, and watch a Bill Nye video on buoyancy.
Curated OER
Who Wants to Carry a Million?
Young scholars, in groups, determine the volume of a box large enough to hold a million dollars. They calculate the dimensions of a bill and the volume of the money.
Curated OER
Conversions: Metrics Made Easy
Young scholars, in groups, measure and record each other's height. They identify measurement conversion methods and use online resources to convert measured heights to multiple systems.
Curated OER
Rhythm In Motion
Sixth graders work independently and with a partner to demonstrate proficiency of steady beat, meter and basic note values while creating written rhythmic patterns for class performance. State and National Standards are addressed.
Curated OER
Whole Numbers
Student are assigned one of the sections on whole numbers. After reviewing the content, they teach their assigned sections to other class mates. They publish their findings on a PowerPoint slide show to use when they teach their section.
Other popular searches
- Fractions to Decimals
- Fractions Decimals Percents
- Percent Fractions Decimals
- Fractions to Decimals Games
- Fractions Decimals List
- Ordering Fractions Decimals
- Change Fractions to Decimals
- Decimals and Fractions
- Relating Fractions Decimals
- Fractions Decimals Percents
- Fractions Decimals Inquiry
- Convert Fractions to Decimals
