Alabama Learning Exchange
The World of Integers
Review operations related to rational numbers and integers using the include PowerPoint presentation, "Interesting Integers." Young mathematicians classify rational numbers as being natural, whole, or integers and read an article about...
Mathematics Assessment Project
Optimizing Coverage: Security Cameras
Are you being watched? Class members determine where to place security cameras protecting a shop. They then evaluate their own and several provided solutions.
Rochester Institute of Technology
Skateboard Assembly - Line Balance
Utilize the lesson on utilization. The second installment of a nine-part technology/engineering series teaches scholars about the flow of a balanced assembly line and the definition of utilization. Videos, activities, and simulations...
Curated OER
How much is a movie worth?
Young scholars discover how much a movie is worth. They use decimals and percentages greater than 100 to complete this activity.
Curated OER
Reading Trees: Understanding Dendrochronology
Students examine tree-ring dating and discuss the lack of water the settlers in Jamestown faced. They create paper tree rings, simulate rain patterns, and describe the history of construction paper tree sequences.
Curated OER
Charging Up, Charging Down: Exponential Models
Students collect and analyze voltage data. In this math lesson plan, students investigate exponential functions using the TI and a Voltage Probe. They graph their data and analyze it using a table.
Curated OER
Better Than Average
Students analyze how to calculate averages, and discuss the use of averages in baseball. They calculate averages and decimals to thousandths using the data on baseball cards.
Curated OER
Identifying Place Value
Third graders complete math problems. In this place value lesson, 3rd graders solve problems that require them to write the place value of a number in expanded form and identify the place value and expanded form of three digit...
Curated OER
Money Circulation: A Story of Trade and Commerce
Students are introduced to the meaning, symbolism, and value of the quarter. They determine the percentage of total monetary value held in quarters and graph the results. Students infer about the U.S. Mint's distrubution of coins. They...
Curated OER
Adding and Subtracting Decimals
Students practice adding and subtracting numbers with decimals. In this decimals lesson plan, students use grid paper and money to learn how to add and subtract decimals.
Curated OER
Adding and Subtracting Decimals
Fourth graders develop the concept of adding and subtracting decimals. In this decimal lesson, they participate in a teacher directed demonstration of how to add and subtract decimals. They work in teams as each person performs one step...
Curated OER
Decimal Place Value
Fourth graders plug in numbers into a place value chart with decimals to the hundredths place. In this place value lesson plan, 4th graders fill in answers on the SmartBoard and a worksheet.
Curated OER
One Size Fits All, Part 1
Can you tell how tall someone is just by looking at their feet? In this activity, young mathematicians measure their height, arm span, and foot size, graph their findings, and answer questions about how these measurements are related....
Virginia Department of Education
Ground Zero
Don't harbor any negative feelings toward negative numbers. Scholars learn about different classifications of rational numbers, including negative integers. They also develop definitions of the opposite and the absolute value of a...
Curated OER
Graphing
Students collect data to create different types of graphs-line, pie, and bar graphs. They use StarOffice 6.0 to create graphs.
Curated OER
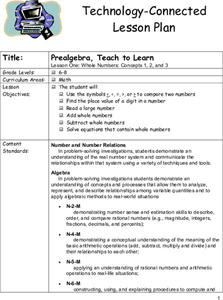
Whole Numbers
Student are assigned one of the sections on whole numbers. After reviewing the content, they teach their assigned sections to other class mates. They publish their findings on a PowerPoint slide show to use when they teach their section.
Curated OER
Comparing Data on Graph A and Graph B
Second graders gather and graph data. In this graphing lesson, 2nd graders collect data and graph this information using tally charts, bar graphs, pictographs, or tables. They make predictions about the outcomes.
Pennsylvania Department of Education
Freckle Face
Students collect and record data. In this early data analysis lesson, students gather data about their partners face. As a class, the students use tally marks and pictographs to record the data and answer question about the information...
Pennsylvania Department of Education
Seeing Doubles
Students work with dominoes to recognize the number of spots on each side as they relate to addition facts. In this seeing doubles lesson, students make triangle shaped flash cards for the double facts. Students represent the correct...
Curated OER
Conversions: Metrics Made Easy
Young scholars, in groups, measure and record each other's height. They identify measurement conversion methods and use online resources to convert measured heights to multiple systems.
Curated OER
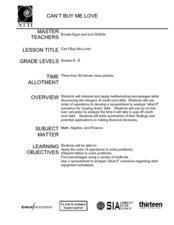
Cannot Buy Me Love
Students investigate the concepts that are related to finance and how it is used in the world. They take part in activities that are focused around the use of a spreadsheet while using a T-chart to simulate a ledger of credits and debits.
Curated OER
Buying My First Car
Students pretend they are about to buy their first new car. They must do all the calculations necessary to estimate the cost of purchasing the car. They see that the math they learn in school really does have real-life applications.
Curated OER
The Great Cover Up!
Students use non-standard measurement tools such as body parts, beans and counters to find the area of shapes drawn on the floor. They continue to determine the area of other objects in the classroom.
Other popular searches
- Ordering Comparing Fractions
- Compare and Order Fractions
- Compare Order Fractions
- Comparing/ordering Fractions

