Curated OER
Pi Day (March 14)
Fourth graders determine the value of ? by measuring the circumference and diameter of circular objects such as soup cans, Oreo cookies, etc..
Curated OER
And the Number Is (Second Grade)
Second graders create Mystery Numbers. They give the class clues about the name, value, and multiples of the digits which make up the number.
Curated OER
Sloping and Intersecting a Linear Function
Students examine and discuss typical linear equations, and the difference between a linear and nonlinear equation. They observe examples of linear equations and complete a worksheet.
Curated OER
Playing With Probability
Learners rotate through work stations where they compute problems of theoretical and experimental probability. In this probability lesson plan, students use simulations of a lottery system.
Curated OER
Examining Estimation
Second graders participate in various activities which help them explain and explain the difference between an estimate and an exact amount.
Curated OER
Ratio and Proportion: Proportional Ratios
In this ratios activity, students write yes or no for if the ratios given are proportional or not. Students complete 7 number problems and 5 money problems.
Curated OER
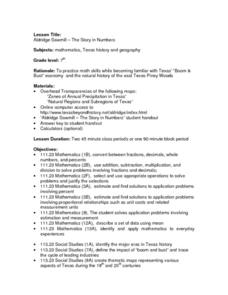
Aldridge Sawmill - The Story in Numbers
Seventh graders practice math skills while becoming familiar with Texas' "Boom & Bust" economy and the natural history of the east Texas Piney Woods. They utilize worksheets and websites imbedded in this plan.
Curated OER
Aldridge Sawmill - The Story in Numbers
Seventh graders view overhead maps of Texas, explore history of Aldrige Sawmill, and practice math skills while becoming familiar with Texas' "Boom & Bust" economy and natural history of east Texas Piney Woods.
Curated OER
Aldridge Sawmill -- The Story in Numbers
Seventh graders view a recent transparency of the average rainfall zones of the state of Texas. Using another transparency, they identify the Piney Woods subregion of the Gulf Coastal Plain and locate national forests and sawmills. ...
Curated OER
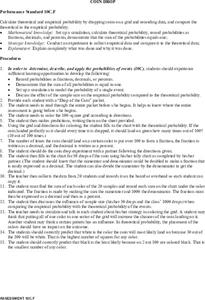
Coin Drop
Students calculate the theoretical and empirical probability by dropping coins on a grid. They record their data and compare the theoretical and empirical data. Students make predictions about the results before conducting the experiment.
Curated OER
Statistics and Shopping
Pupils examine statistics and data analysis concepts from the practical questions that arise in everyday life.
Curated OER
Area graphics for 7th graders
Students randomly select dimensions for three geometric shapes (square, right triangle and circle). From the graphs they compare and contrast the graphical results of each shape.
Curated OER
Cube Combinations
Second graders, given 5 number cubes, roll the cubes and record the data.
Curated OER
Food in History
Students research, predict and offer solutions regarding factors that affect current or future food crops could result in economic, political or social changes.
Curated OER
Are You Absolutely Sure of the Value?
Seventh graders develop an examineing of absolute value through real world situations. They develop an examineing of when absolute value can be used in a given situation.
Curated OER
Irregular Fractals
Students study and research irregular fractals and construct a few based on their research. Students practice pattern recognition skills and plane geometry skills calculating dimensions on the Fractured Pictures activity.
Other popular searches
- Convert Fractions to Percents
- Change Fractions to Percents
- Percents to Fractions
- Changing Fractions to Percents
- Fractions to Percents Game
- Math Fractions to Percents


