Curated OER
Feature column: Hands on Math With Technology
Young learners will view a math adventures video and practice math concepts. Afterwards they will navigate through Internet sites to participate in teacher selected math adventures. This guide walks you through integrating...
One Billion
Math, Age 3-5
Jump start children's math education with this fun basic skills resource. Offering dozens of different touch-and-swipe activities with colorful graphics, this program is perfect for all young learners.
Curated OER
Technology Integrated Lesson
Students investigate symmetry in the real world. In this geometry lesson, students inter-relate math and technology. They create and name a variety of polygons.
Texas Instruments
TI-Nspire™ CAS
When it comes to rating educational calculators, this calculator is always near the top of this list. Now it's available as an app. There is a lot of calculator power wrapped up in this app. Not only is this a fully functioning...
Curated OER
Hands On Math Lessons with Technology
Students explore a variety of math concepts. In this integrating technology lesson, students visit online webtools such as Max's Math Adventure, I Know That Math, Hands on Banking, and more. A description of each website is provided.
Curated OER
Workshop Lesson: Digital Camera
Students perform an activity in small groups in order to investigate different types of shapes found in photographs taken with a digital camera. The integration of technology is used to engage students in the lesson.
Curated OER
Tessellations in Excel
Students complete an Excel project on tessellations. In this technology and math lesson, students discuss tessellations and their occurrences in nature. Students use the Excel computer program to create tessellations.
Curated OER
A Borrower And A Lender Be
Second graders practice addition and subtraction in this fun, technology-based Mathematics lesson for the second grade classroom. The lesson includes resource links, video clips, interactive websites, and a section for pre-lesson...
Teach Engineering
What a Drag!
Stop and drop what is in your hand! Pupils investigate how form effects drag in the 12th part of a 22-part unit on aviation. Groups create equally weighted objects and determine which one falls the fastest by collecting data.
Teach Engineering
Energy Forms and States Demonstrations
Does a tennis ball have energy? What about a bowling ball? Demonstrate concepts of different forms of energy forms and states with a variety of objects. Using the equations for potential and kinetic energy,...
Curated OER
Beginning Graphs in MS Excel
Young scholars practice creating graphs in Microsoft Excel. In this technology lesson plan, students conduct a random survey and collect data. Young scholars use the Microsoft Excel program to create a bar graph of the data.
Rice University
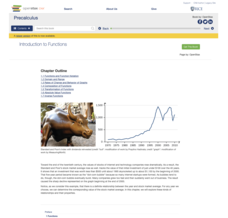
Precalculus
Take a step beyond Algebra 2. Learners use the eBook to learn concepts from the typical Precalculus course. Content starts off with a short review of functions in general and moves on to the basic functions, finishing up with more...
Visa
Pro Lesson Module — Financial Football
Learners won't fumble their knowledge of personal finance after an engaging game of Financial Football! As they choose their favorite teams and desired plays, young economists demonstrate their financial literacy with a question...
Curated OER
Publisher Brochures
Students create brochures on subjects they are studying in Publisher. In this nonfiction writing instructional activity, students use Publisher to create a brochure telling all the main ideas of a topic they are studying. Students use...
Curated OER
What's My Structure
Fourth graders use the language of mathematics to describe in words a 3-D structure created with one-inch cube. They interpret a written description of a 3-D structure and re-create it with one-inch cubes. Students use Quick Time...
Curated OER
In Debt or Not In Debt
Students investigate the use of credit cards. In this algebra instructional activity, students differentiate the interest rate of credit cards and how to stay debt free. They identify pros and cons of credit cards.
Curated OER
Eye From the Sky
Students are introduced to the concept of aerial perspective and scale. Students will use satellite technology to view their neighborhoods and sketch the area surrounding their schools. They will take part in a neighborhood walk to view...
Curated OER
Getting Into Shapes: Identifying and Describing Two-Dimensional Shapes
Young scholars examine their classroom to find examples of various types of shapes. After identifying and describing the various shapes, they draw as many as they can on a piece of paper. They organize them into an image based on their...
Texas Instruments
TI-Nspire™
We landed on the moon with less computing capabilities than you can find in this app! Here is a multiple function calculator that takes all the power you get from a handheld and adds the wonderful large screen that only a tablet can...
Curated OER
How Many Is Too Many?
Students explore the population explosion. They view a video depicting the exponential growth of human population. Students research the internet to project future population data. They perform hands-on, multimedia activities to study...
Education World
Putting Turkey on a Table (or a Graph)
Grateful learners put turkey on a table (or a graph)! Through a creative project they show statistical information about turkey population, production, and consumption. A great Thanksgiving lesson that can be applied at any time to the...
Curated OER
If the World Were a Village...
Your class members explore concept that the world is a large place, examine how statistics can be used to help in understanding the world and its people, and create illustrations or graphs of statistics found in the award-winning...
Curated OER
Holiday Greeting Cards: A Graphing Activity
Young scholars examine statistics about the popular type of greeting cards and create pie or bar chart using an online tool. They illustrate the sales statistics for the greeting cards before making the charts.
Curated OER
Graph the Results: Applesauce Taste Test
Students work together to make applesauce following specific directions. They taste each applesauce and graph the results based on the taste test. They also use the internet to create an online graph.
