Curated OER
Leveled Problem Solving: Range and Outliers
In this range and outliers learning exercise, students solve 6 word problems where they examine data then identify outliers, find the upper and lower quartile ranges, find the interquartile range and create box-and-whisker plots.
Curated OER
Statistics: Standard Deviation and Outliers
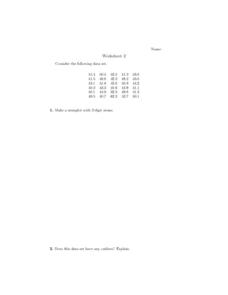
In this statistics worksheet, statisticians construct a stem-plot and answer questions regarding the shape of the distribution, standard deviation, and outliers.
Curated OER
Data Management and Probability: Applications
In this data management and probability applications worksheet, 8th graders solve 20 various types of probability problems. They find the mean, median, mode and range of various numbers. Then, students use the spinner illustration to...
Curated OER
Scatterplots
In this scatterplots learning exercise, students construct a scatter plot from a given data set. Students then answer 4 questions regarding the least-squares regression line and making predictions.
Curated OER
Stem-and-Leaf Plots
In this stem-and-leaf plots worksheet, 9th graders solve and complete 9 various types of problems. First, they determine the mean, median, and mode of the stem-and-leaf plot shown. Then, students summarize the similarities and...
Curated OER
Scatterplots and Regressions
In this scatterplots and regressions worksheet, students solve 6 different types of problems related to graphing scatterplots and interpreting regressions. First, they create a scatterplot from the given data coordinates and then,...
Curated OER
Stemplots
In this stem plot learning exercise, students construct 3 stem plots. Students answer 1 question about outliers and another question regarding which stem plot is preferred.
Curated OER
Explanatory and Response Variables
In this explanatory and response variables worksheet, students answer 4 problems surrounding variable relationships and outliers. Student must construct a scatter plot.
Georgia Department of Education
The Basketball Star
Have learners use math to prove they are sports stars! Assess a pupil's ability to create and analyze data using a variety of graphs. The class will be motivated by the association of math and basketball data.
Curated OER
Data Analysis Self-Test
In this data analysis worksheet, students complete 1 problem that has 7 parts involving mean, median, mode, range, and quartiles. Students then perform 5 operations with matrices.
Other popular searches
- Line Plot Outliers
- Outliers Box Plots
- Gaps,clusters, Outliers
- Outliers and Data
- Outliers Interquartile Range
- Clusters and Outliers
- Range and Outliers
- Outliers Boxplots
- Mean Median Mode Outliers
- How Outliers Affect Mean
- Gapsclusters Outliers
- Outliers Inter Quartile Range


